
|
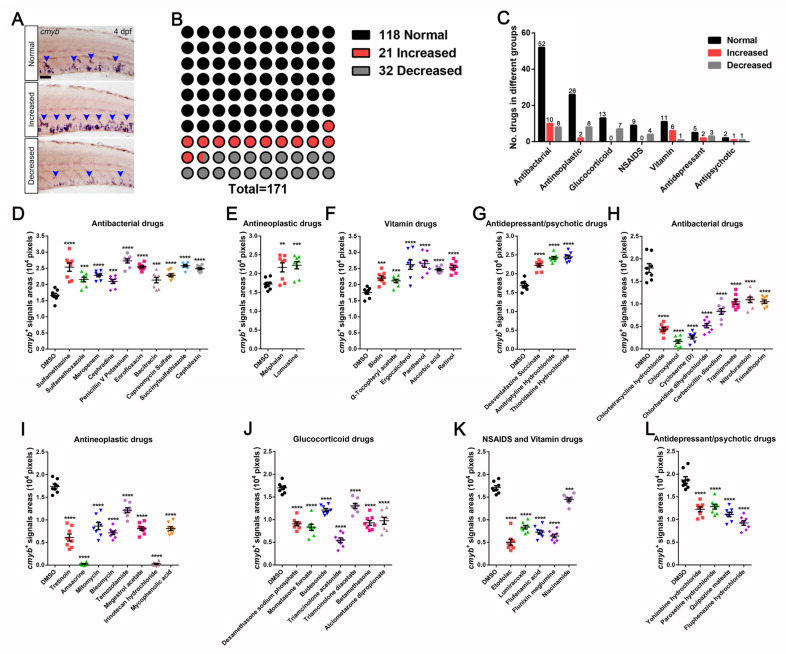
Figure 2
Preliminary FDA-approved drug screening results for cmyb+ HSPCs in zebrafish embryos. (A) Examples of screening and phenotyping between cmyb in situ hybridization phenotypes in comparison with the normal control zebrafish. (B) Statistical summary of drugs available, including normal signals (118 compounds), increased signals (21 compounds), and decreased signals (32 compounds). (C) Statistical diagram of drugs represented by each category. (D–G) The drug treatments augment cmyb+ signals. (D) Antibacterial drugs (Pixels; DMSO, 16,680 ± 608; Sulfamethazine, 25,360 ± 1281; Sulfamethoxazole, 21,540 ± 699; Meropenem, 22,790 ± 443; Cephradine, 20,940 ± 616; Penicillin V Potassium, 27,290 ± 647; Enrofloxacin, 25,450 ± 355; Bacitracin, 21,350 ± 841; Capreomycin Sulfate, 22,860 ± 454; Succinylsulfathiazole, 25,800 ± 341; Cephalexin, 24,890 ± 348). (E) Antineoplastic drugs (Pixels; DMSO, 17,230 ± 509; Melphalan, 21,650 ± 1205; Lomustine, 22,230 ± 963). (F) Vitamin drugs (Pixels, DMSO, 17,530 ± 552; Biotin, 22,050 ± 651; α-Tochopheryl acetate, 21,130 ± 528; Ergocalciferol, 26,190 ± 1457; Panthenol, 26,490 ± 1084; Ascorbic acid, 24,610 ± 345; Retinol, 25,380 ± 622). (G) Antidepressant/psychotic drugs (Pixels; DMSO, 16,910 ± 483; Desvenlafaxine Succinate, 22,210 ± 437; Amitriptyline hydrochloride, 24,230 ± 362; Thioridazine hydrochloride, 24,450 ± 421). (H–L) The drug treatment diminishes cmyb+ signals. (H) Antibacterial drugs (Pixels; DMSO, 17,940 ± 985; Chlortetracycline hydrochloride, 4400 ± 3402; Chloroxylenol, 1625 ± 380; Cycloserine (D), 2600 ± 369; Chlorhexidine dihydrochloride, 5163 ± 479; Carbenicillin disodium, 8325 ± 638; Tramiprosate, 10,450 ± 543; Nitrofurantoin, 10,900 ± 614; Trimethoprim, 10,480 ± 376). (I) Antineoplastic drugs (Pixels; DMSO, 17,410 ± 505; Tretinoin, 6088 ± 783; Amsacrine, 238 ± 107; Mitomycin, 8625 ± 802; Bleomycin, 7125 ± 394; Temozolamide, 12,130 ± 531; Megestrol acetate, 8075 ± 420; Irinotecan hydrochloride, 263 ± 145; Mycophenolic acid, 8063 ± 431). (J) Glucocorticoid drugs (Pixels; DMSO, 17,000 ± 398; Dexamethasone sodium phosphate, 9075 ± 433; Mometasone furoate, 8325 ± 676; Budesonide, 12,140 ± 332; Triamcinolone acetonide, 5463 ± 512; Triamcinolone diacetate, 13,040 ± 532; Betamethasone, 9288 ± 539; Alclometazone dipropionate, 9738 ± 767). (K) NSAIDS and Vitamin drugs (Pixels; DMSO, 17,080 ± 440; Etodolac, 5025 ± 663; Lumiracoxib, 8350 ± 385; Flufenamic acid, 7250 ± 436; Flunixin meglumine, 6400 ± 400; Niacinamide, 14,450 ± 383). (L) Antidepressant/psychotic drugs (Pixels; DMSO, 18,710 ± 729; Yohimbine hydrochloride, 12,240 ± 535; Paroxetine hydrochloride, 12,830 ± 546; Quipazine maleate, 11,100 ± 502; Fluphenazine hydrochloride, 9238 ± 509). Scale bar, 50 μm; Mean ± SEM, n = 8; ** p< 0.01, *** p < 0.001, **** p < 0.0001.