FIGURE SUMMARY
Title

Insights into in vivo adipocyte differentiation through cell-specific labeling in zebrafish

Authors
Lepanto, P., Levin-Ferreyra, F., Koziol, U., Malacrida, L., Badano, J.L.
Source
Full text @ Biol. Open

fabp4a(-2.7):EGFPcaax is expressed in early and mature adipocytes. (A) The upper scheme shows the endogenous fabp4a gene in chromosome 19 with the transcription start site (TSS), exons (boxes), introns, and the coding sequence (CDS) in red. The cloned region is denoted between dashed lines. The lower scheme represents the vector used for transgenesis (tol2: tol2 sites; pA: SV40_late_polyA; cmlc2: cardiac myosin light chain 2 upstream region). (B) Epifluorescence microscopy images of live fabp4a(-2.7):EGFPcaax larvae from the incross of the F3 generation labeled with LipidTOX-Red. EGFP+ cells were present in the PVAT and AVAT depots. Asterisks indicate mature adipocytes stained with LipidTOX-Red with low (*) or high EGFPcaax expression (**). Single arrows denote early adipocytes expressing EGFPcaax with small lipid droplets. Double arrows indicate early adipocytes with EGFPcaax expression without LipidTOX-Red staining. sb, swim bladder; g, gut. Scale bars: B: panoramic views: 200 µm; insets: 50 µm.

Comparison of the expression pattern of fabp4a(-2.7):EGFPcaax and endogenous fabp4a mRNA in larva. Images of fabp4a(-2.7):EGFPcaax larvae of 21 dpf processed for WMISH, immunolabeled with anti-GFP and analyzed in toto through confocal microscopy. (A) Panoramic (upper row) and magnified image (lower row) of the abdominal region of a larva labeled with fabp4a antisense probe. Yellow arrows denote the coincidence of EGFPcaax (immunofluorescence) and WMISH signal. Arrows with asterisks show regions with WMISH labeling and no EGFP signal. (B) Panoramic (upper row) and magnified image (lower row) of the abdominal region of a larva labeled with fabp4a sense probe. Yellow double arrows indicate regions with EGFPcaax signal without WMISH labeling. (C) Intensity profile of FITC fluorescence along the lines indicated in A and B insets. (D) Images of the trunk of a larva labeled with fabp4a antisense probe. Blue single arrows indicate pigment cells with EGFPcaax signal. Blue double arrows show WMISH labeling in blood vessels. Scale bars: A and B: 100 μm (upper row), 20 μm (lower row); D: 100 μm.

Distribution of labeled cells in the abdominal region of live fabp4a(-2.7):EGFPcaax larva of different stages. Larvae of the indicated stages were stained with LipidTOX-Red, mounted in agarose and imaged using confocal microscopy. (A) Transmitted light and 3D projection images of a larva of SL 4.5 mm (8 dpf). Yellow rectangles denote cells with transgene labeling. Insets A1 and A2 show confocal sections of these regions. Note the membrane localization of EGFP and the lack of LipidTOX-Red labeling. Cyan arrows indicate pigment cells expressing the transgene. (B) 3D projection images of a larva of SL 5 mm (12 dpf). Yellow rectangles denote EGFP+ cells, magnified in B1 and B2. Cells with lipid droplets as well as without them (yellow arrows) can be seen in the same larva in different positions. (C) 3D projection images of a larva of SL 6.3 mm (16 dpf) with initial PVAT depot formation. Note the presence of EGFP+ cells with unique cell-filling lipid droplets, irregular cells with several lipid droplets (yellow double arrows) and small cells without lipid droplets (yellow single arrows). Asterisks indicate cells without EGFP expression. sb, swim bladder; g, gut. Scale bars: A: 100 μm (panoramic view); 10 μm (insets); B: 100 μm (panoramic view); 20 μm (insets); C: 100 μm (panoramic view); 20 μm (insets).

Interaction of early adipocytes with blood vessels. Live larvae from the cross of fabp4a(-2.7):EGFPcaax and kdlr:mCherry fish lines were imaged through confocal microscopy. Images presented here are 3D projections or single sections, as indicated. (A) Larva of SL 6 mm (13 dpf) with many EGFP+ cells in its abdominal area, a few of them having lipid droplets (inset A1). Some of the cells are in contact with blood vessels (double arrows) and some of them are not (single arrows). (B) Larva of SL 7 mm (16 dpf), with PVAT and AVAT depots (only some cells of each depot expresses EGFP). Insets B1, B2 and B3 show EGFP+ cells with lipid droplets in close apposition to blood vessels and in some cases surrounding them (B2). 3D projections and sections through the position indicated by the dashed line are shown. Scale bars: A: 100 μm; B: 100 μm (panoramic view), 20 μm (insets).

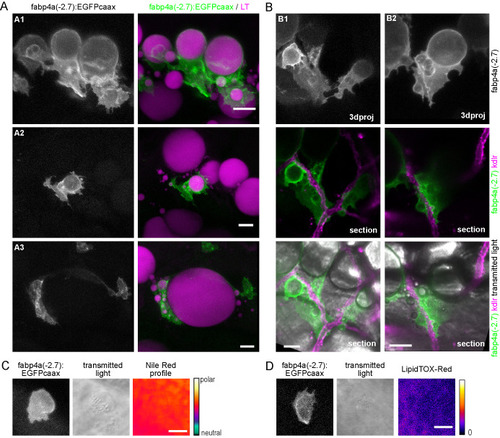
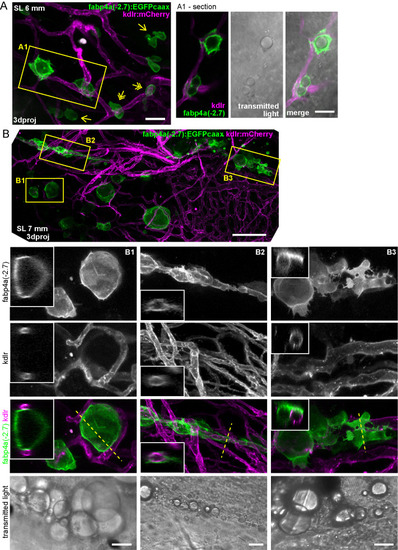
Different cell morphologies observed in fabp4a(-2.7):EGFPcaax larvae. (A) fabp4a(-2.7):EGFPcaax larvae of 21 dpf were labeled with LipidTOX-Red and imaged in vivo through confocal microscopy. Images are 3D projections of confocal stacks, to show different cell morphologies found in these larvae. (B) Images of fabp4a(-2.7):EGFPcaax; kdlr:mCherry larvae of SL 8 mm (19 dpf). Note labeled cells in the AVAT depot with cytoplasmic projections which lay in close apposition to blood vessels. Images are 3D projections or sections as indicated. (C,D) High magnification confocal sections of EGFP+ cells in larvae stained with Nile Red (C) or LipidTOX-Red (D). The cytoplasmic inclusions observed in transmitted light in these cells showed a polar lipid profile (evidenced by Nile Red staining, C) and low signal intensity of LipidTOX-Red (D). Scale bars: A: 20 μm; B: 20 μm; C,D: 10 μm.

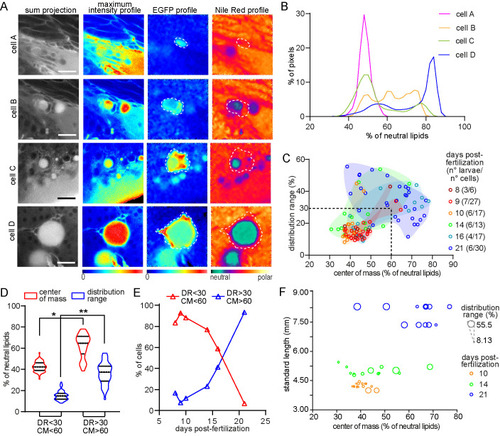
Larvae in different stages present cells with distinct lipid metabolic profiles. (A) Representative hyperspectral images of adipocytes (‘cell A’ to ‘cell D’) in different stages of differentiation. Raw images are presented in gray and intensity based color scale. Images generated after phasor plot analysis make evident the EGFP and Nile Red profiles which are represented separately by different color scales. Scale bars: A: 20 μm. (B) Plot with the normalized distribution of the image pixels with respect to the fraction (expressed as percentage) of neutral lipids for each cell in A. (C) Scatter plot showing the distribution range and center of mass of the cells analyzed in different larval stages. Both variables are expressed as the percentage of neutral lipids. The group of data coming from the same larval stage were enclosed by a manually generated convex hull shape just for visualization purposes. The dashed lines (DR=30; CM=60) generates the two regions considered in D and E. The numbers in brackets indicate the total number of larvae and the total number of cells analyzed in each stage. (D) Data within (DR<30/CM<60) and outside (DR>30/CM>60) the region considered in C were separated and compared. For CM: (*) P=2.06×10⁻¹³ for median comparison (Mann–Whitney test), P=1.62×10⁻⁴ for coefficient of variation comparison (Fligner-Killeen test); (**) P=2.24×10⁻¹⁶ for median comparison (Mann–Whitney test), P=7.1×10⁻⁶ (Fligner-Killeen test). (E) Representation of the percentage of cells in each group (DR<30/CM<60 and DR>30/CM>60) with respect to the larval stage presented in dpf. (F) Representation of the distribution range (as the size of the dots) and center of mass for the cells within some of the larva analyzed; each larva had a different standard length.

Acknowledgments
This image is the copyrighted work of the attributed author or publisher, and ZFIN has permission only to display this image to its users. Additional permissions should be obtained from the applicable author or publisher of the image. Full text @ Biol. Open