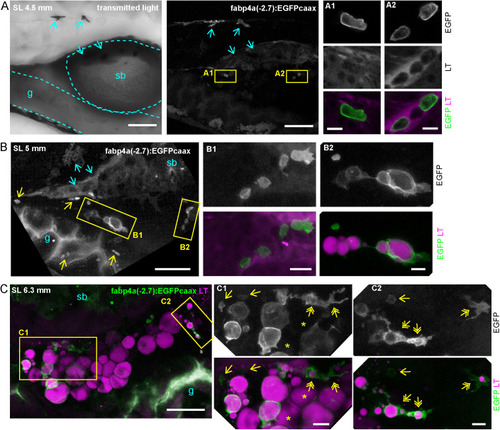
Distribution of labeled cells in the abdominal region of live fabp4a(-2.7):EGFPcaax larva of different stages. Larvae of the indicated stages were stained with LipidTOX-Red, mounted in agarose and imaged using confocal microscopy. (A) Transmitted light and 3D projection images of a larva of SL 4.5 mm (8 dpf). Yellow rectangles denote cells with transgene labeling. Insets A1 and A2 show confocal sections of these regions. Note the membrane localization of EGFP and the lack of LipidTOX-Red labeling. Cyan arrows indicate pigment cells expressing the transgene. (B) 3D projection images of a larva of SL 5 mm (12 dpf). Yellow rectangles denote EGFP+ cells, magnified in B1 and B2. Cells with lipid droplets as well as without them (yellow arrows) can be seen in the same larva in different positions. (C) 3D projection images of a larva of SL 6.3 mm (16 dpf) with initial PVAT depot formation. Note the presence of EGFP+ cells with unique cell-filling lipid droplets, irregular cells with several lipid droplets (yellow double arrows) and small cells without lipid droplets (yellow single arrows). Asterisks indicate cells without EGFP expression. sb, swim bladder; g, gut. Scale bars: A: 100 μm (panoramic view); 10 μm (insets); B: 100 μm (panoramic view); 20 μm (insets); C: 100 μm (panoramic view); 20 μm (insets).
|
