
Fig. 5.
- ID
- ZDB-FIG-210922-23
- Publication
- Lepanto et al., 2021 - Insights into in vivo adipocyte differentiation through cell-specific labeling in zebrafish
- Other Figures
- All Figure Page
- Back to All Figure Page
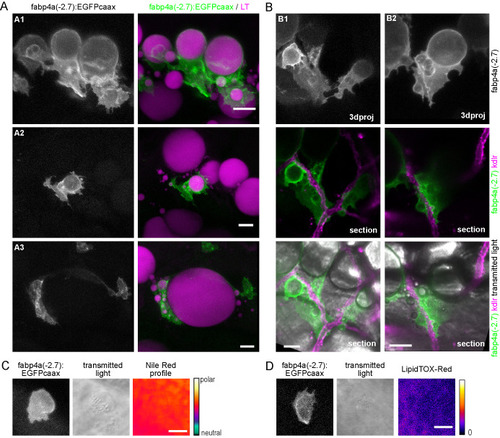
Different cell morphologies observed in fabp4a(-2.7):EGFPcaax larvae. (A) fabp4a(-2.7):EGFPcaax larvae of 21 dpf were labeled with LipidTOX-Red and imaged in vivo through confocal microscopy. Images are 3D projections of confocal stacks, to show different cell morphologies found in these larvae. (B) Images of fabp4a(-2.7):EGFPcaax; kdlr:mCherry larvae of SL 8 mm (19 dpf). Note labeled cells in the AVAT depot with cytoplasmic projections which lay in close apposition to blood vessels. Images are 3D projections or sections as indicated. (C,D) High magnification confocal sections of EGFP+ cells in larvae stained with Nile Red (C) or LipidTOX-Red (D). The cytoplasmic inclusions observed in transmitted light in these cells showed a polar lipid profile (evidenced by Nile Red staining, C) and low signal intensity of LipidTOX-Red (D). Scale bars: A: 20 μm; B: 20 μm; C,D: 10 μm. |