IMAGE

Fig. 2.

ID
ZDB-IMAGE-210922-22
Source
Figures for Lepanto et al., 2021
Image
Figure Caption

Fig. 2.

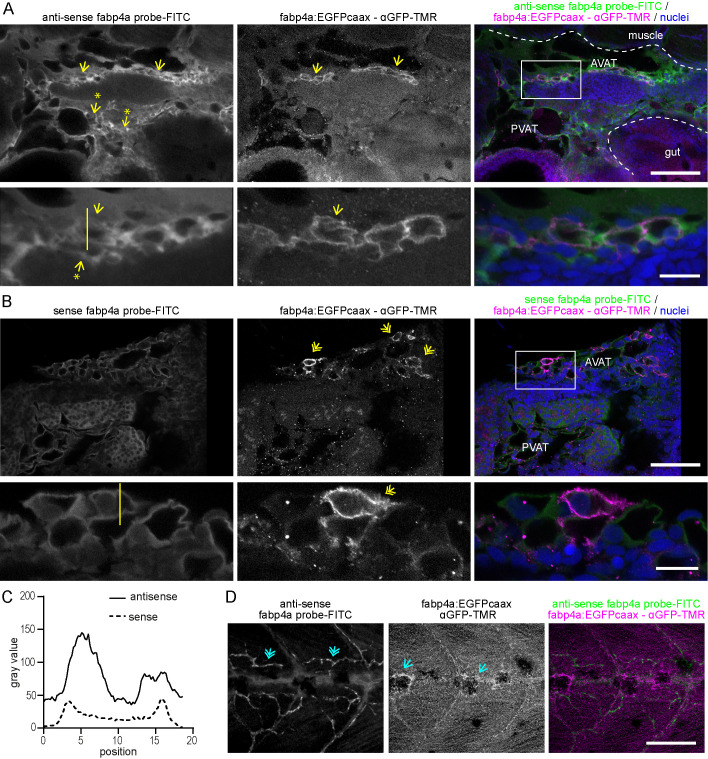
Comparison of the expression pattern of fabp4a(-2.7):EGFPcaax and endogenous fabp4a mRNA in larva. Images of fabp4a(-2.7):EGFPcaax larvae of 21 dpf processed for WMISH, immunolabeled with anti-GFP and analyzed in toto through confocal microscopy. (A) Panoramic (upper row) and magnified image (lower row) of the abdominal region of a larva labeled with fabp4a antisense probe. Yellow arrows denote the coincidence of EGFPcaax (immunofluorescence) and WMISH signal. Arrows with asterisks show regions with WMISH labeling and no EGFP signal. (B) Panoramic (upper row) and magnified image (lower row) of the abdominal region of a larva labeled with fabp4a sense probe. Yellow double arrows indicate regions with EGFPcaax signal without WMISH labeling. (C) Intensity profile of FITC fluorescence along the lines indicated in A and B insets. (D) Images of the trunk of a larva labeled with fabp4a antisense probe. Blue single arrows indicate pigment cells with EGFPcaax signal. Blue double arrows show WMISH labeling in blood vessels. Scale bars: A and B: 100 μm (upper row), 20 μm (lower row); D: 100 μm.

Acknowledgments
This image is the copyrighted work of the attributed author or publisher, and ZFIN has permission only to display this image to its users. Additional permissions should be obtained from the applicable author or publisher of the image. Full text @ Biol. Open