FIGURE SUMMARY
Title

In vivo validation of a computationally predicted conserved Ath5 target gene set

Authors
Del Bene, F., Ettwiller, L., Skowronska-Krawczyk, D., Baier, H., Matter, J.M., Birney, E., Wittbrodt, J.
Source
Full text @ PLoS Genet.

Ath5 Promoter Alignment and Characterization

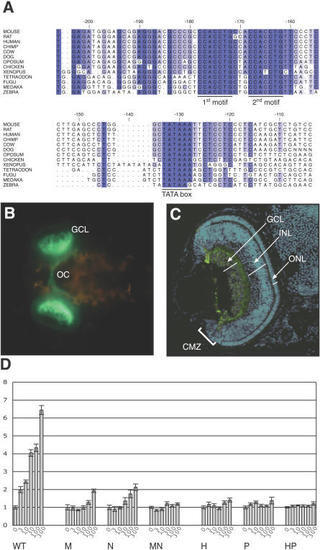
(A) Proximal promoter region alignment of ath5 in various vertebrate species. Numbering indicates bases 5′ of the start codon.

(B, C) Transgenic medaka embryos at day four of development. (C) Cryosection and anti-GFP antibody staining of a transgenenic embryo representing the full Ath5 expression pattern. Note that the reporter is weakly expressed all over the mature retina and specifically enriched in the GCL and in a few other cells indicated by arrows. Complete absence of expression is observed in the distal part of the ciliary marginal zone as well as outside the eye. Nuclei are visualized by DAPI counterstaining. CMZ, ciliary marginal zone; GCL, ganglion cell layer; INL, inner nuclear layer; ONL outer nuclear layer; and OC, optic chiasm.

(D) Transactivation of Ath5 on its own promoter assayed by luciferase reporter transcription activity. Two-kilobase Ath5 promoter or its mutant forms generated by PCR introducing base changes into the two conserved binding motifs were used (see Table S3 for oligo sequences). Values on the x-axis are the quantity (in ng) of Ath5pCS2+ -expressing vector transfected. WT corresponds to the wild-type promoter, M and N are mutations of the first and second conserved e-boxes, respectively, without disrupting the e-box consensus sequence. H and P are mutations of the first and second conserved e-boxes, respectively, with disruption of the e-box consensus sequence. MN and HP are mutations in both e-boxes without and with disruption of both e-boxes, respectively (see Materials and Methods for details)

Developmental Time-Course of the Expression of <italic>ath5</italic> (A–E) and Three Examples Representing the Major Groups of Target Genes

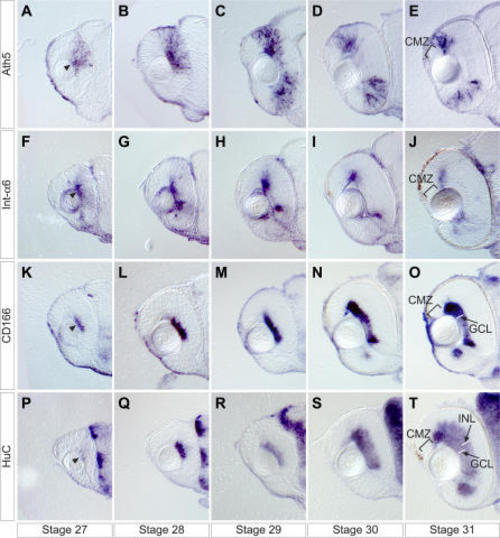
Embryos are stained by whole mount in situ hybridization and sectioned transversally at the level of the optic nerve. int-α6 overlaps with ath5 expression and follows it (F–J). CD166 is continuous with the ath5 expression domain and then remains in the cells that had expressed ath5 in the ganglion cell layer (K–O). HuC is expressed in the ganglion cell layer and part of the inner nuclear layer (P–T), during medaka retina development from stage 27 to stage 31. Arrowheads indicate the simultaneous onset of the expression in the central retina of the target genes within ath5 expression domain at stage 27. CMZ, ciliary marginal zone; GCL, ganglion cell layer; and INL, inner nuclear layer.

Double In Situ for <italic>ath5</italic> (Red in All Pictures) and Target Gene (Blue) Expression in Stage 32 (Day 4) Medaka Retinae

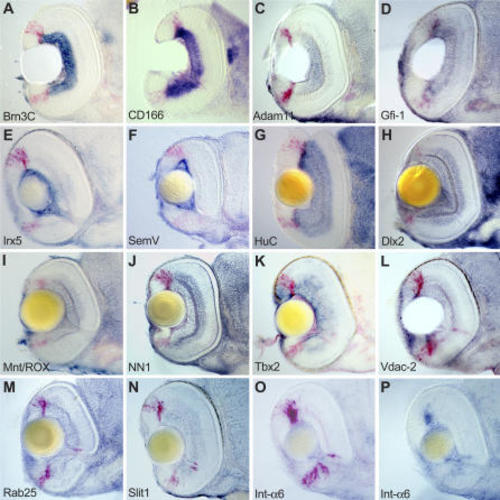
(A–P) Embryos are sectioned transversally at the level of the optic nerve. Dorsal is to the top. Abbreviations of target genes are indicated in Table S1.

Ectopic Activation of Target Genes in Response to Ectopic Ath5 In Vivo

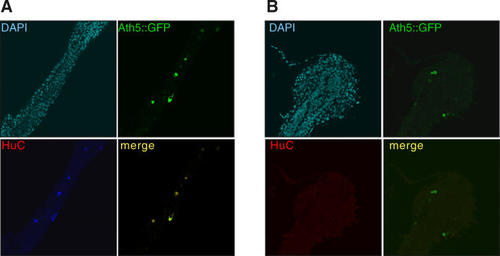
(A, B) Mosaic expression of Ath5 leads to activation of target genes in those cells expressing Ath5. Upper left, DAPI nuclear staining; lower left, HuC fluorescent in situ; upper right, GFP reporter indicating Ath5 expression; and lower right, merge of GFP and in situ signals. (A) Medaka embryo injected with 2-kb Ath5 promoter driving GFP expression in response to Ath5 and Ath5 pCS2+ expression vector. Note the complete overlap of Ath5 activity and expression of its target HuC. (B) Medaka embryo control injected with 2-kb Ath5 promoter driving GFP expression and empty pCS2+ vector.

In Vivo Occupancy of Four New Target Promoters by Ath5

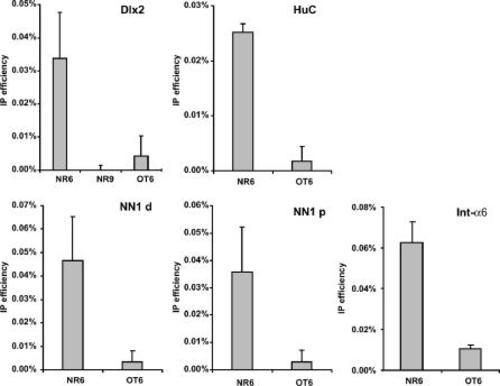
Antibody directed against Ath5 was used to immunoprecipitate crosslinked chromatin fragments prepared from chicken neuroretina and optic tectum. Occupation was measured by real time PCR with primers specific for the predicted target genes (Dlx2, HuC, NN-1, and Int-α6). In one case, NN-1, the two predicted binding sites within the promoter region are at a distance sufficient to discriminate between the different occupancies of each of them with the resolution of the ChIP technique (about 700 bp). Both sites are in vivo occupied at different levels. In the y-axis, the absolute ChIP efficiency is indicated. NR6, neuroretina at day 6 post fertilization; NR9, neuroretina at day 9 post fertilization; OT6, optic tectum at day 6 post fertilization; d, distal; and p, proximal.

Acknowledgments
This image is the copyrighted work of the attributed author or publisher, and ZFIN has permission only to display this image to its users. Additional permissions should be obtained from the applicable author or publisher of the image. Full text @ PLoS Genet.