
Figure 1
- ID
- ZDB-IMAGE-210821-13
- Publication
- Del Bene et al., 2007 - In vivo validation of a computationally predicted conserved Ath5 target gene set
- All Figures
- Figures for Del Bene et al., 2007
|
Figure 1
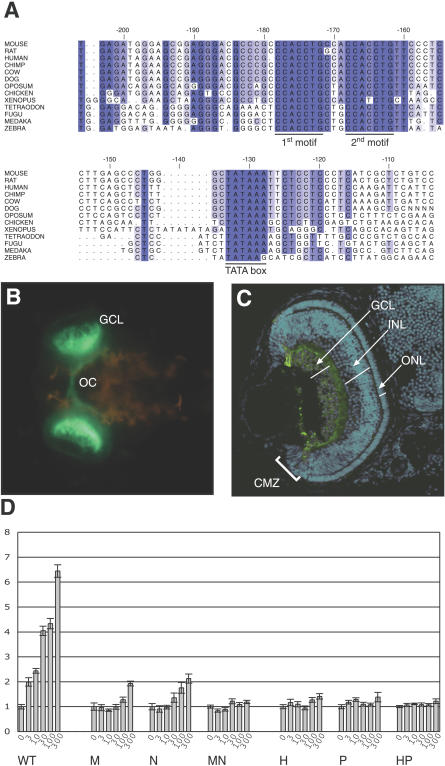
(A) Proximal promoter region alignment of
(B, C) Transgenic medaka embryos at day four of development. (C) Cryosection and anti-GFP antibody staining of a transgenenic embryo representing the full Ath5 expression pattern. Note that the reporter is weakly expressed all over the mature retina and specifically enriched in the GCL and in a few other cells indicated by arrows. Complete absence of expression is observed in the distal part of the ciliary marginal zone as well as outside the eye. Nuclei are visualized by DAPI counterstaining. CMZ, ciliary marginal zone; GCL, ganglion cell layer; INL, inner nuclear layer; ONL outer nuclear layer; and OC, optic chiasm.
(D) Transactivation of Ath5 on its own promoter assayed by luciferase reporter transcription activity. Two-kilobase Ath5 promoter or its mutant forms generated by PCR introducing base changes into the two conserved binding motifs were used (see