FIGURE SUMMARY
Title

REST is a major negative regulator of endocrine differentiation during pancreas organogenesis

Authors
Rovira, M., Atla, G., Maestro, M.A., Grau, V., García-Hurtado, J., Maqueda, M., Mosquera, J.L., Yamada, Y., Kerr-Conte, J., Pattou, F., Ferrer, J.
Source
Full text @ Genes & Dev.

Rest inactivation in pancreatic progenitors induces NEUROG3. (A) Neurog3 mRNA increases in E13 and E18 RestpKO pancreas. Normalization by Hprt mRNA; n = 3–4 mice per group. (B) Western blot and quantifications of NEUROG3 in nuclear extracts from E13.5 control and RestpKO pancreas. LamininB1 was used as loading control. n = 2 samples per group with a pull of three E13.5 pancreas per sample. (C) Immunofluorescence for NEUROG3 (red), cytokeratin 19 (CK19; green), and DAPI (blue) in E18.5 control and RestpKO pancreas. Arrowheads indicate NEUROG3+ cells. Bars show NEUROG3+ CK19+ cells in E18.5 pancreas. Scale bar, 100 µm. (D) Immunofluorescence for NEUROG3 (red), Ki67 (green), and DAPI (gray) in E18.5 pancreas. Empty arrowheads indicate NEUROG3+Ki67− cells, and white arrowheads indicate NEUROG3+Ki67+ cells. n = 4–6 mice per group. Scale bar, 50 µm. (E) Representative whole mounts for NEUROG3+ (red), DBA (green), and insulin (blue) of the tail of E18.5 control and RestpKO pancreas. Scale bars, 100 µm. Error bars are SEM. (*) P ≤ 0.05, (**) P ≤ 0.01.

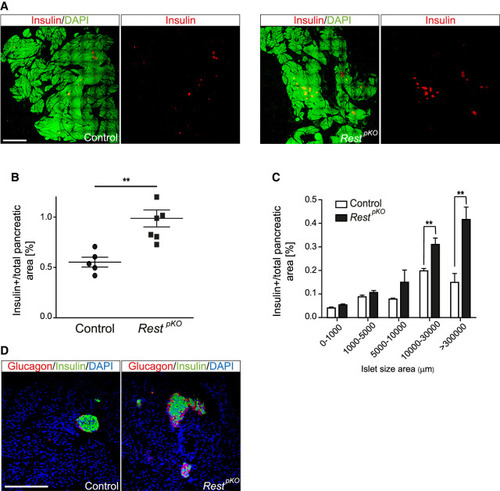
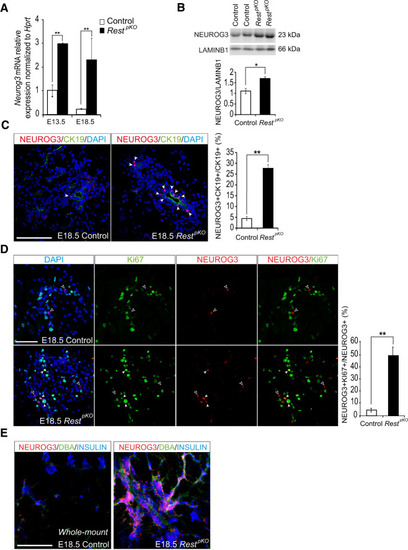
Increased β-cell mass in RestpKO mice. (A) Representative images of 10 × 10 frame reconstructions used for β-cell morphometry of insulin (red) and DAPI (green) stainings in pancreas from 12-wk-old control and RestpKO mice. Scale bar, 2 mm. (B) Morphometry of β-cell mass estimated from insulin surface area/total DAPI surface area (percentage). RestpKO mice have an approximately twofold increase in β-cell mass. n = 12 sections from five to six mice in each group. (C) Islet size in control and RestpKO adult pancreas. (D) Representative immunofluorescence for glucagon (red), insulin (green), and DAPI (blue) in whole-pancreas from 12-wk-old control and RestpKO pancreas. Scale bar, 200 µm. Error bars indicate SEM. (**) P ≤ 0.01.

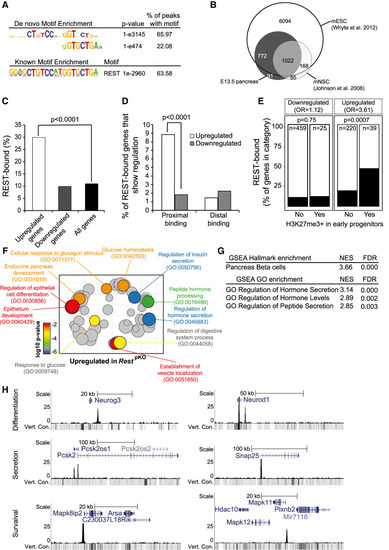
Functional direct REST targets in the embryonic pancreas. (A) Top de novo and known motif enrichments in REST-bound regions. (B) REST-bound regions in E13.5 pancreas, mESCs, and mNSCs. (C) Percentage of up-regulated and down-regulated genes in RestpKO mice, or all genes, that were bound by REST. Results indicate that REST predominantly acts as a repressor. P-values are Fisher exact test. (D) REST binds preferentially to promoter-proximal (0- to 5-kb) regions of genes that were up-regulated in RestpKO mice. (E) Percentage of differentially expressed genes that were bound by REST, broken down by H3K27me3 enrichment in purified pancreatic progenitors in (van Arensbergen et al. 2010). REST binding was enriched in genes that were up-regulated in RestpKO and showed H3K27me3 in progenitors. P-values from Fisher exact test. (F) Up-regulated genes were functionally annotated using Gorilla (Eden et al. 2009), and REVIGO (Supek et al. 2011) was used to visualize annotation clusters. The most significant terms are highlighted according to a P-value color scale. (G) Significant GSEA terms for up-regulated genes. (H) REST binding associated to pancreatic endocrine development (Neurog3 and NeuroD1), insulin secretion (Snap25 and Pcsk2), and β-cell survival (Mapk11 and Mapk8ip2) genes in E13.5 pancreas. Y-axes are −log10 P-values. The vert. cons. track depicts vertebrate conservation.

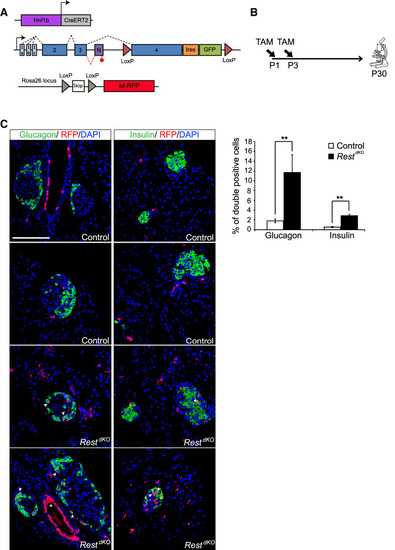
Pancreas-specific inactivation of Rest in neonatal ducts. (A) Schematic of genetic models used to inactivate Rest and activate RFP expression in duct cells and progeny. Hnf1b-CreERT2 is a BAC transgenic that specifically marks duct cells (Solar et al. 2009), as well as non-Rest-expressing ∂ cells in reporters that are excised with high efficiency (Rovira et al. 2021), but not other endocrine or acinar cells. (B) Schematic of the lineage tracing experiment. Tamoxifen was given to mothers at day 1 (P1) and day 3 (P3) after delivery, and mice were analyzed at P30. Hnf1b-CreERT2;Rosa26RFP control mice were also treated. (C) Representative images of double-positive RFP (red) and insulin (green) cells and of double-positive RFP (red) and glucagon (green) cells in RestdKO and control mice. The graph shows RFP-expressing glucagon and insulin cells in RestdKO versus control mice. n = 5–6 mice per each group. Arrowheads indicate double-positive cells, and an asterisk marks examples of cells in a duct, which were very efficiently labelled. Scale bar, 100 µm. Error bars are SEM. Student's t-test; (**) P < 0.01.

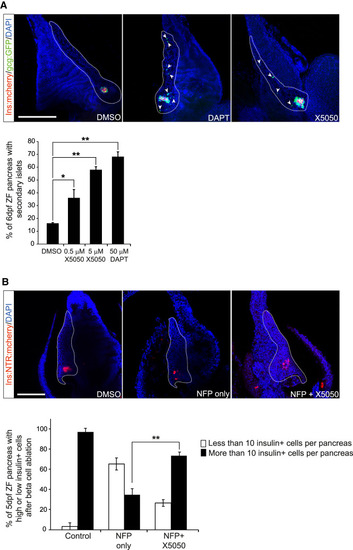
REST regulation of endocrine differentiation is conserved in zebrafish. (A) Embryos of Ins:mCherry/Gcga:GFP double-transgenic zebrafish line treated with 50 µM DAPT (Notch inhibitor used as positive control), 0.5 or 5 µM X5050, or vehicle (DMSO, negative control) from 3 dpf until 6 dpf. After drug treatment at 6 dpf, zebrafish pancreas was dissected, and the presence or absence of secondary islets was quantified. Arrows show representative secondary islets of double-transgenic zebrafish embryos (Ins:mCherry/Gcga:GFP; [blue] DAPI). The graph shows the percentage of zebrafish with detectable secondary islets in each condition. n = 20–25 fish per each condition. (B) An Ins:NTR-mCherry line was used to selectively ablate β cells upon treatment with 5 µM nifurpirinol (NFP) (Pisharath et al. 2007; Bergemann et al. 2018) in 3-dpf embryos; 24 h later after complete β-cell ablation of the principal islet, embryos were exposed to 5 µM ×5050 or vehicle, and β cells were analyzed 36 h later. Representative images of β-cell regeneration in Ins:NTR-mCherry embryos treated with vehicle (DMSO), with NFP only, or with NFP and X5050. (Red) Insulin, (blue) DAPI. The graph shows the percentage of pancreas showing >10 insulin-expressing cells in every condition. n = 32–36 fish per each condition. Scale bars, 200 µm. Error bars are SEM. (**) P < 0.01, (*) P < 0.05, χ2 test.

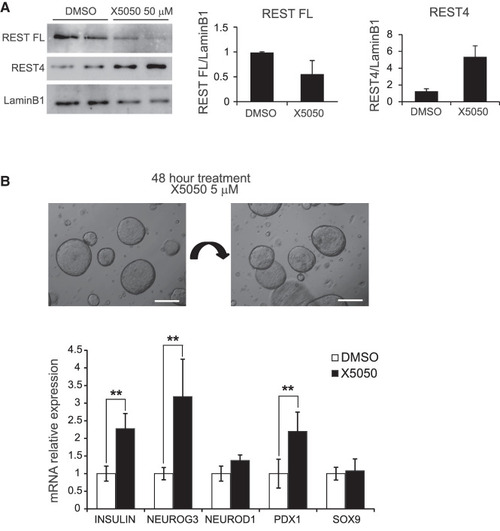
REST chemical inhibition in human pancreatic organoids. (A) Western blot analysis of REST FL (full-length) and REST4 protein levels in PANC1 cells treated with X5050 50 µM or DMSO (control). (Lamin B1) Loading control. Bar plot shows the quantification of the Western blot for REST. (B) Human organoids generated from pancreatic exocrine fractions from two cadaveric donors were treated at passage 3 for 48 h with 5 µM X5050 or DMSO (control vehicle). qPCR analysis of mRNA for indicated genes, relative to TBP. Scale bars, 200 µm. Error bars are SD. Student's t-test, (**) P < 0.01.

Acknowledgments
This image is the copyrighted work of the attributed author or publisher, and ZFIN has permission only to display this image to its users. Additional permissions should be obtained from the applicable author or publisher of the image. Full text @ Genes & Dev.