IMAGE

Figure 2.

ID
ZDB-IMAGE-220214-8
Source
Figures for Rovira et al., 2021
Image
Figure Caption

Figure 2.

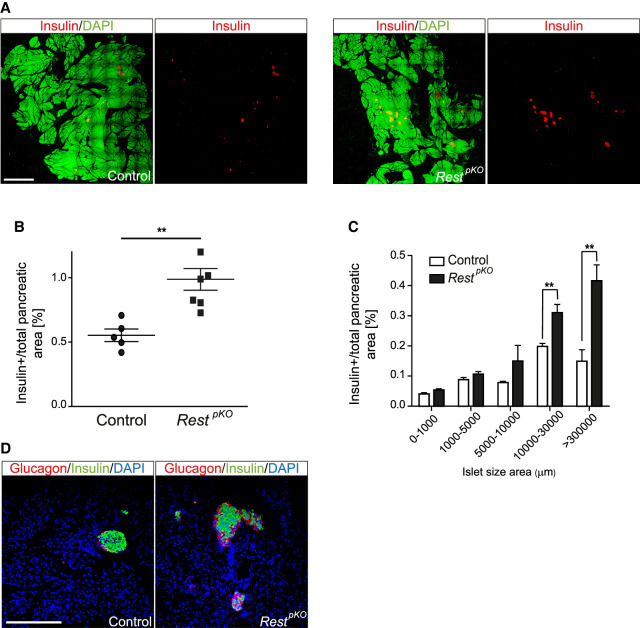
Increased β-cell mass in RestpKO mice. (A) Representative images of 10 × 10 frame reconstructions used for β-cell morphometry of insulin (red) and DAPI (green) stainings in pancreas from 12-wk-old control and RestpKO mice. Scale bar, 2 mm. (B) Morphometry of β-cell mass estimated from insulin surface area/total DAPI surface area (percentage). RestpKO mice have an approximately twofold increase in β-cell mass. n = 12 sections from five to six mice in each group. (C) Islet size in control and RestpKO adult pancreas. (D) Representative immunofluorescence for glucagon (red), insulin (green), and DAPI (blue) in whole-pancreas from 12-wk-old control and RestpKO pancreas. Scale bar, 200 µm. Error bars indicate SEM. (**) P ≤ 0.01.

Acknowledgments
This image is the copyrighted work of the attributed author or publisher, and ZFIN has permission only to display this image to its users. Additional permissions should be obtained from the applicable author or publisher of the image. Full text @ Genes & Dev.