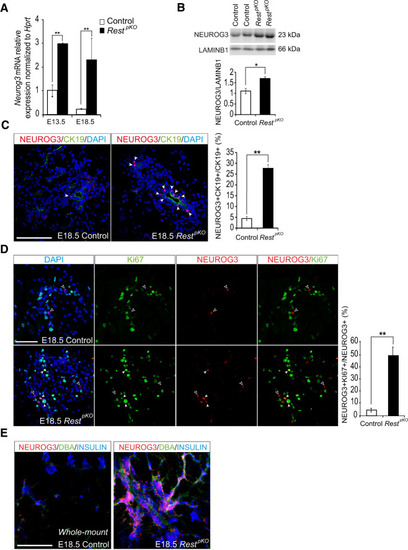
Rest inactivation in pancreatic progenitors induces NEUROG3. (A) Neurog3 mRNA increases in E13 and E18 RestpKO pancreas. Normalization by Hprt mRNA; n = 3–4 mice per group. (B) Western blot and quantifications of NEUROG3 in nuclear extracts from E13.5 control and RestpKO pancreas. LamininB1 was used as loading control. n = 2 samples per group with a pull of three E13.5 pancreas per sample. (C) Immunofluorescence for NEUROG3 (red), cytokeratin 19 (CK19; green), and DAPI (blue) in E18.5 control and RestpKO pancreas. Arrowheads indicate NEUROG3+ cells. Bars show NEUROG3+ CK19+ cells in E18.5 pancreas. Scale bar, 100 µm. (D) Immunofluorescence for NEUROG3 (red), Ki67 (green), and DAPI (gray) in E18.5 pancreas. Empty arrowheads indicate NEUROG3+Ki67− cells, and white arrowheads indicate NEUROG3+Ki67+ cells. n = 4–6 mice per group. Scale bar, 50 µm. (E) Representative whole mounts for NEUROG3+ (red), DBA (green), and insulin (blue) of the tail of E18.5 control and RestpKO pancreas. Scale bars, 100 µm. Error bars are SEM. (*) P ≤ 0.05, (**) P ≤ 0.01.
|
