
|
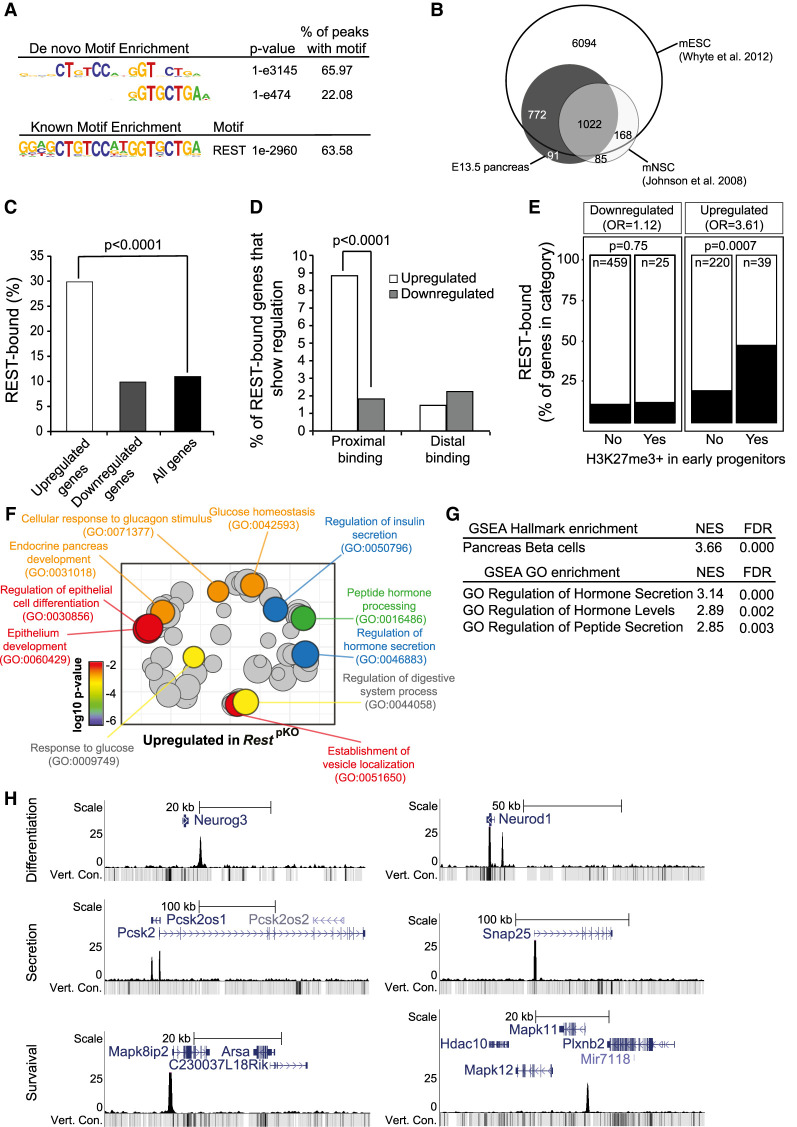
Figure 3.
Functional direct REST targets in the embryonic pancreas. (A) Top de novo and known motif enrichments in REST-bound regions. (B) REST-bound regions in E13.5 pancreas, mESCs, and mNSCs. (C) Percentage of up-regulated and down-regulated genes in RestpKO mice, or all genes, that were bound by REST. Results indicate that REST predominantly acts as a repressor. P-values are Fisher exact test. (D) REST binds preferentially to promoter-proximal (0- to 5-kb) regions of genes that were up-regulated in RestpKO mice. (E) Percentage of differentially expressed genes that were bound by REST, broken down by H3K27me3 enrichment in purified pancreatic progenitors in (van Arensbergen et al. 2010). REST binding was enriched in genes that were up-regulated in RestpKO and showed H3K27me3 in progenitors. P-values from Fisher exact test. (F) Up-regulated genes were functionally annotated using Gorilla (Eden et al. 2009), and REVIGO (Supek et al. 2011) was used to visualize annotation clusters. The most significant terms are highlighted according to a P-value color scale. (G) Significant GSEA terms for up-regulated genes. (H) REST binding associated to pancreatic endocrine development (Neurog3 and NeuroD1), insulin secretion (Snap25 and Pcsk2), and β-cell survival (Mapk11 and Mapk8ip2) genes in E13.5 pancreas. Y-axes are −log10 P-values. The vert. cons. track depicts vertebrate conservation.