IMAGE

Figure 5.

ID
ZDB-IMAGE-220214-10
Source
Figures for Rovira et al., 2021
Image
Figure Caption

Figure 5.

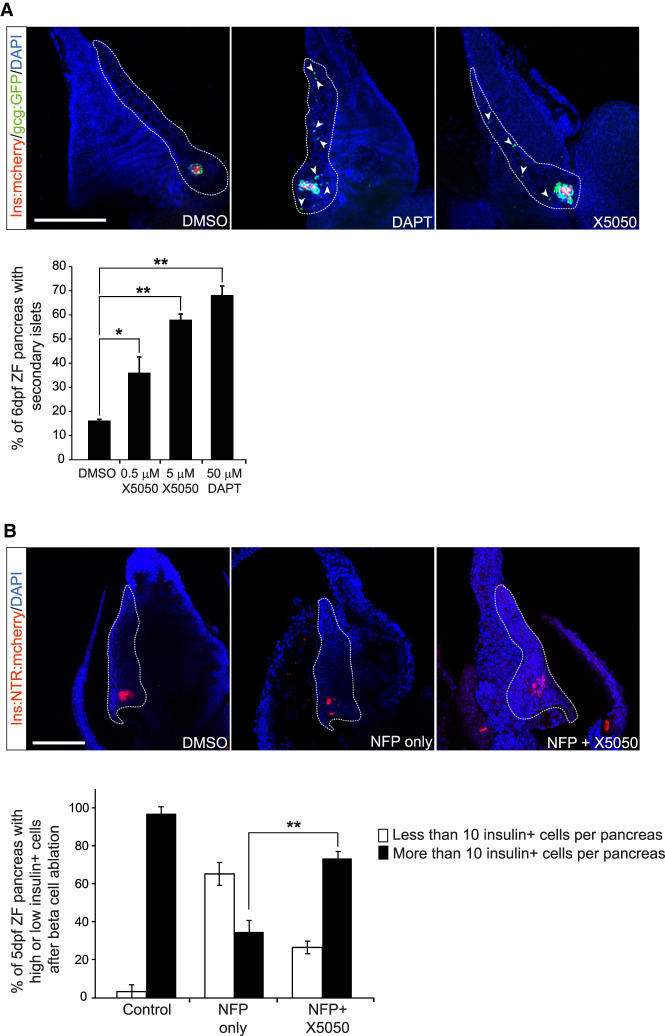
REST regulation of endocrine differentiation is conserved in zebrafish. (A) Embryos of Ins:mCherry/Gcga:GFP double-transgenic zebrafish line treated with 50 µM DAPT (Notch inhibitor used as positive control), 0.5 or 5 µM X5050, or vehicle (DMSO, negative control) from 3 dpf until 6 dpf. After drug treatment at 6 dpf, zebrafish pancreas was dissected, and the presence or absence of secondary islets was quantified. Arrows show representative secondary islets of double-transgenic zebrafish embryos (Ins:mCherry/Gcga:GFP; [blue] DAPI). The graph shows the percentage of zebrafish with detectable secondary islets in each condition. n = 20–25 fish per each condition. (B) An Ins:NTR-mCherry line was used to selectively ablate β cells upon treatment with 5 µM nifurpirinol (NFP) (Pisharath et al. 2007; Bergemann et al. 2018) in 3-dpf embryos; 24 h later after complete β-cell ablation of the principal islet, embryos were exposed to 5 µM ×5050 or vehicle, and β cells were analyzed 36 h later. Representative images of β-cell regeneration in Ins:NTR-mCherry embryos treated with vehicle (DMSO), with NFP only, or with NFP and X5050. (Red) Insulin, (blue) DAPI. The graph shows the percentage of pancreas showing >10 insulin-expressing cells in every condition. n = 32–36 fish per each condition. Scale bars, 200 µm. Error bars are SEM. (**) P < 0.01, (*) P < 0.05, χ2 test.

Acknowledgments
This image is the copyrighted work of the attributed author or publisher, and ZFIN has permission only to display this image to its users. Additional permissions should be obtained from the applicable author or publisher of the image. Full text @ Genes & Dev.