- Title
-
Autophagy induction promotes renal cyst growth in polycystic kidney disease
- Authors
- Lee, E.J., Ko, J.Y., Oh, S., Jun, J., Mun, H., Lim, C.J., Seo, S., Ko, H.W., Kim, H., Oh, Y.K., Ahn, C., Kang, M., Kim, M.J., Yoo, K.H., Oh, G.T., Park, J.H.
- Source
- Full text @ EBioMedicine
|
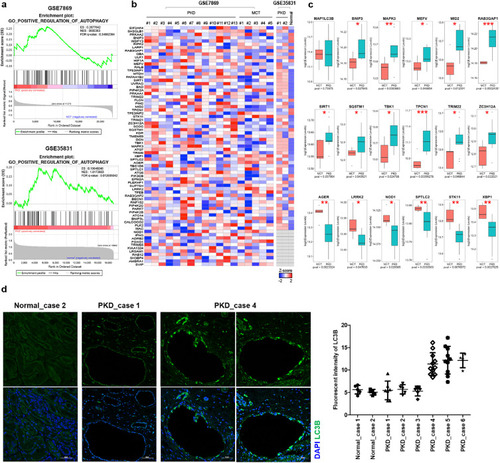
(a) Gene set enrichment analysis of 75 autophagy-related genes between ADPKD and control groups. (b) Heatmaps of genes that are from Fig. 1a. in each sample. (c) Expression levels of MAP1LC3B and other significantly altered genes from GSE7869 involved in positive regulation of autophagy. Statistical analysis performed using t-tests, and P < 0.05 was considered statistically significant (* P < 0.05, ** P < 0.01, *** P < 0.001). (d) Immunofluorescent staining of human kidney tissues with or without PKD for LC3B. Fluorescence intensity of the signals was quantified by green histogram analyses using Image J program.(For interpretation of the references to color in this figure legend, the reader is referred to the web version of this article.) |
|
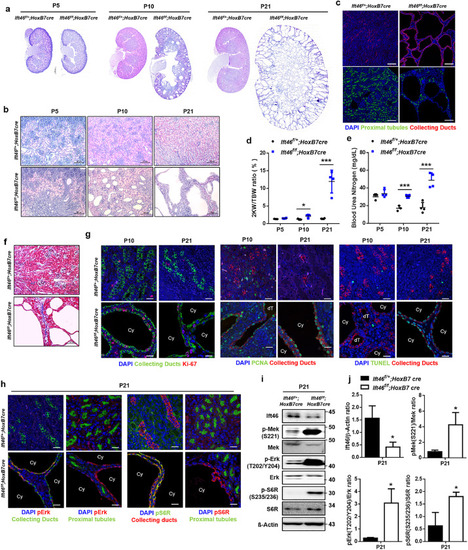
(a) Haematoxylin and eosin (H&E)-stained sections of Ift46flox/+; HoxB7-Cre and Ift46flox/flox; HoxB7-Cre kidneys at p5, p10, and p21. Scale bar, 500 µm. (b) High magnification image of H&E-stained sections of Ift46flox/+; HoxB7-Cre and Ift46flox/flox; HoxB7-Cre kidneys at p5, p10, and p21. Scale bar, 100 µm. (c) The kidneys of Ift46flox/+; HoxB7-Cre and Ift46flox/flox; HoxB7-Cre mice (p21) stained with markers for collecting ducts (red), proximal tubules (green) and nuclei (DAPI, blue). Scale bar, 100 µm. (d) Ratio of the weight of two kidneys (2KW) to the total body weight (TBW) of Ift46flox/+; HoxB7-Cre and Ift46flox/flox; HoxB7-Cre mice at p5, p10, and p21. Data are shown as mean ± SD; n ≥ 3 for each time point; *p < 0.05, ***p < 0.005. (e) Blood urea nitrogen (BUN) levels in the kidneys of Ift46flox/+; HoxB7-Cre and Ift46flox/flox; HoxB7-Cre mice at p5, p10, and p21. Data are shown as mean ± SD; n ≥ 3 for each time point; ***p < 0.005. (f) Masson's trichrome staining of kidney sections of Ift46flox/+; HoxB7-Cre and Ift46flox/flox; HoxB7-Cre kidneys at p21. Scale bar, 100 µm. (g) Kidneys of Ift46flox/+; HoxB7-Cre and Ift46flox/flox; HoxB7-Cre mice (p10, p21) stained with markers for collecting duct (green or red), Ki-67 (red), PCNA (green), TUNEL (green) and nuclei (DAPI, blue). Scale bar, 20 µm. (h) Kidneys of Ift46flox/+; HoxB7-Cre and Ift46flox/flox; HoxB7-Cre mice were stained for collecting ducts (green or red), proximal tubules (green), pS6R (green or red), pErk (red) and nuclei (DAPI, blue) at p21. Scale bar, 20 µm. (i) Western blot analysis of MAPK/ERK and mTOR signaling using whole kidney lysates of Ift46flox/+; HoxB7-Cre and Ift46flox/flox; HoxB7-Cre mice at p21. (j) Quantification of band intensity observed in panel (i). Data are shown as mean ± SD; n ≥ 3 for each time point; *p < 0.05.(For interpretation of the references to color in this figure legend, the reader is referred to the web version of this article.). |
|
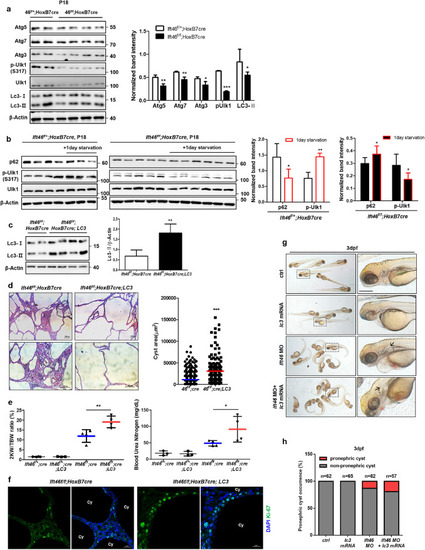
(a) Reduced expression of autophagy-regulating proteins including Atg5, Atg7, Atg3, p-Ulk1 (S317) and Lc3 in Ift46flox/flox; HoxB7-Cre mice. (b) Inhibited autophagy flux upon 1-day starvation in Ift46flox/flox; HoxB7-Cre mice. (c) The protein expression level of Lc3 in Ift46flox/flox; HoxB7-Cre; Lc3. (d) Haematoxylin and eosin (H&E)-stained sections of Ift46flox/flox; HoxB7-Cre; Lc3 mice at p21. Scale bar, 100 μm. Cyst area was quantified by Image J program. Data are shown as mean ± SD. (e) Ratio of the weight of two kidneys (2KW) to the total body weight (TBW) and blood urea nitrogen (BUN) level of Ift46flox/flox; HoxB7-Cre mice at p21. (f) Staining of cystic kidney tissues of Ift46flox/flox; HoxB7-Cre mice with or without Lc3 overexpression for Ki-67 to reveal changes in cell proliferation. Scale bar, 20 μm. Data are shown as mean ± SD; n ≥ 3 and P < 0.05 was considered statistically significant (* P < 0.05, ** P < 0.01, *** P < 0.001). (g) Zebrafish embryos injected with indicated morpholino (MO) and lc3 mRNA at 3 dpf. Arrows indicate pronephric cysts. Scale bar, 0.3 mm. (h) Graph showing occurrence of pronephric cysts in indicated groups. PHENOTYPE:
|
|
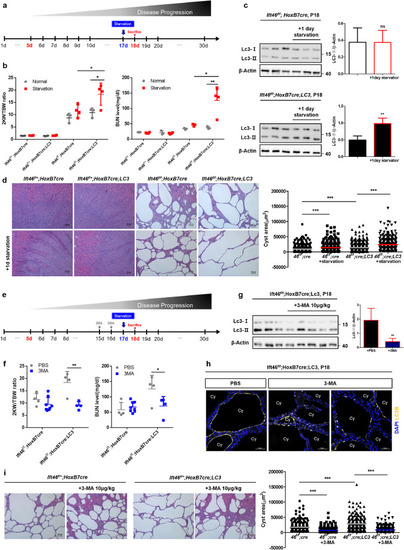
(a) Schedule for starving mice to stimulate autophagy in Ift46flox/flox; HoxB7-Cre mice with or without Lc3 overexpression. (b) Testing renal function based on the ratio of the weight of two kidneys (2KW) to the total body weight (TBW) and blood urea nitrogen (BUN) level. (c) Immunoblotting analysis shows changes in Lc3 level in Ift46flox/flox; HoxB7-Cre mice with or without Lc3 overexpression after 1-day starvation. (d) Haematoxylin and eosin (H&E)-stained sections of Ift46flox/flox; HoxB7-Cre mice with or without Lc3 overexpression after 1-day starvation. Scale bar, 100 μm. Cyst area was quantified by Image J program. Data are shown as mean ± SD. (e) Schedule for 3-methyladenine (3-MA) injection into Ift46flox/flox; HoxB7-Cre mice with or without Lc3 overexpression. (f) Change in the 2KW/TBW ratio and BUN level. (g) Reduced Lc3 level in Ift46flox/flox; HoxB7-Cre; Lc3 mice injected with 3-MA. (h) Expression and localization of LC3 in cystic renal tissues of control or experimental groups. Scale bar, 50 μm. (i) H&E-stained sections of Ift46flox/flox; HoxB7-Cre mice with or without Lc3 overexpression upon 24 h starvation after 3-MA injection. Scale bar, 100 μm. Cyst area was quantified by Image J program. Graphs represent data as mean ± SD; n ≥ 3 for each group and P < 0.05 was considered statistically significant (* P < 0.05, ** P < 0.01, *** P < 0.001). . |
|
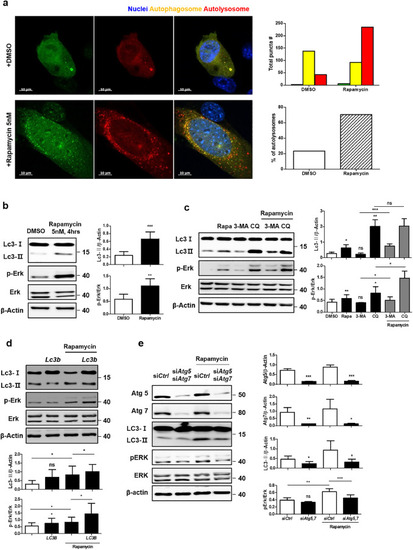
(a) Ratio of autophagosomes fused with lysosomes after 5 nM rapamycin treatment for 4 h. Scale bar, 10 μm. (b) Change in Erk phosphorylation with 5 nM rapamycin treatment for 4 h. (c) Effect of autophagy inhibitors including 3-methyladenine (3-MA) (1 mM) and chloroquine (CQ) (50 μM) on Erk phosphorylation. (d) Increase in Erk phosphorylation in Lc3-overexpressed cells with rapamycin treatment (5 nM, 4 h). (e) Decrease in Erk phosphorylation in Atg5- and Atg7-silenced cells with rapamycin treatment. All data were obtained from a minimum of three independent experiments. Statistical analysis performed using one-tailed t-tests, and P < 0.05 was considered statistically significant (* P < 0.05, ** P < 0.01, *** P < 0.001). |
|
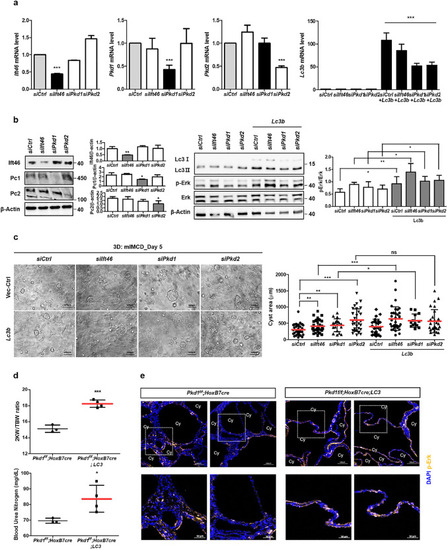
(a) Screening of mRNA expression level after transfection of Ift46 siRNA, Pkd1 siRNA, Pkd2 siRNA or Lc3. (b) Changes in expression of the proteins including Ift46, Pc-1, Pc-2, and Lc3 and Erk phosphorylation. (c) Cysts observed by in vitro 3D culture after increasing Lc3 expression and counts of in vitro cystic area for each group. Graphs represent data as mean ± SD; n > 20 for each group. (d) Changes of the ratio of the weight of two kidneys (2KW) to the total body weight (TBW) and blood urea nitrogen (BUN) level in Pkd1flox/flox; HoxB7-Cre; Lc3 mice. (e) Fluorescent staining of phosphorylated Erk in kidney tissues. Lower panels are enlarged from upper ones. Scale bar, 100 μm for images with high magnification and 50 μm for zoom-in images. Graphs represent data as mean ± SD; n ≥ 3 for each group and P < 0.05 was considered statistically significant (* P < 0.05, ** P < 0.01, *** P < 0.001). |

