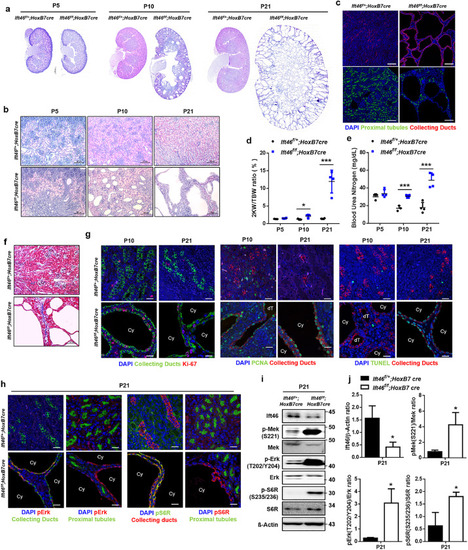
Fig. 2
- ID
- ZDB-FIG-220408-2
- Publication
- Lee et al., 2020 - Autophagy induction promotes renal cyst growth in polycystic kidney disease
- Other Figures
- All Figure Page
- Back to All Figure Page
|
(a) Haematoxylin and eosin (H&E)-stained sections of Ift46flox/+; HoxB7-Cre and Ift46flox/flox; HoxB7-Cre kidneys at p5, p10, and p21. Scale bar, 500 µm. (b) High magnification image of H&E-stained sections of Ift46flox/+; HoxB7-Cre and Ift46flox/flox; HoxB7-Cre kidneys at p5, p10, and p21. Scale bar, 100 µm. (c) The kidneys of Ift46flox/+; HoxB7-Cre and Ift46flox/flox; HoxB7-Cre mice (p21) stained with markers for collecting ducts (red), proximal tubules (green) and nuclei (DAPI, blue). Scale bar, 100 µm. (d) Ratio of the weight of two kidneys (2KW) to the total body weight (TBW) of Ift46flox/+; HoxB7-Cre and Ift46flox/flox; HoxB7-Cre mice at p5, p10, and p21. Data are shown as mean ± SD; n ≥ 3 for each time point; *p < 0.05, ***p < 0.005. (e) Blood urea nitrogen (BUN) levels in the kidneys of Ift46flox/+; HoxB7-Cre and Ift46flox/flox; HoxB7-Cre mice at p5, p10, and p21. Data are shown as mean ± SD; n ≥ 3 for each time point; ***p < 0.005. (f) Masson's trichrome staining of kidney sections of Ift46flox/+; HoxB7-Cre and Ift46flox/flox; HoxB7-Cre kidneys at p21. Scale bar, 100 µm. (g) Kidneys of Ift46flox/+; HoxB7-Cre and Ift46flox/flox; HoxB7-Cre mice (p10, p21) stained with markers for collecting duct (green or red), Ki-67 (red), PCNA (green), TUNEL (green) and nuclei (DAPI, blue). Scale bar, 20 µm. (h) Kidneys of Ift46flox/+; HoxB7-Cre and Ift46flox/flox; HoxB7-Cre mice were stained for collecting ducts (green or red), proximal tubules (green), pS6R (green or red), pErk (red) and nuclei (DAPI, blue) at p21. Scale bar, 20 µm. (i) Western blot analysis of MAPK/ERK and mTOR signaling using whole kidney lysates of Ift46flox/+; HoxB7-Cre and Ift46flox/flox; HoxB7-Cre mice at p21. (j) Quantification of band intensity observed in panel (i). Data are shown as mean ± SD; n ≥ 3 for each time point; *p < 0.05.(For interpretation of the references to color in this figure legend, the reader is referred to the web version of this article.). |

