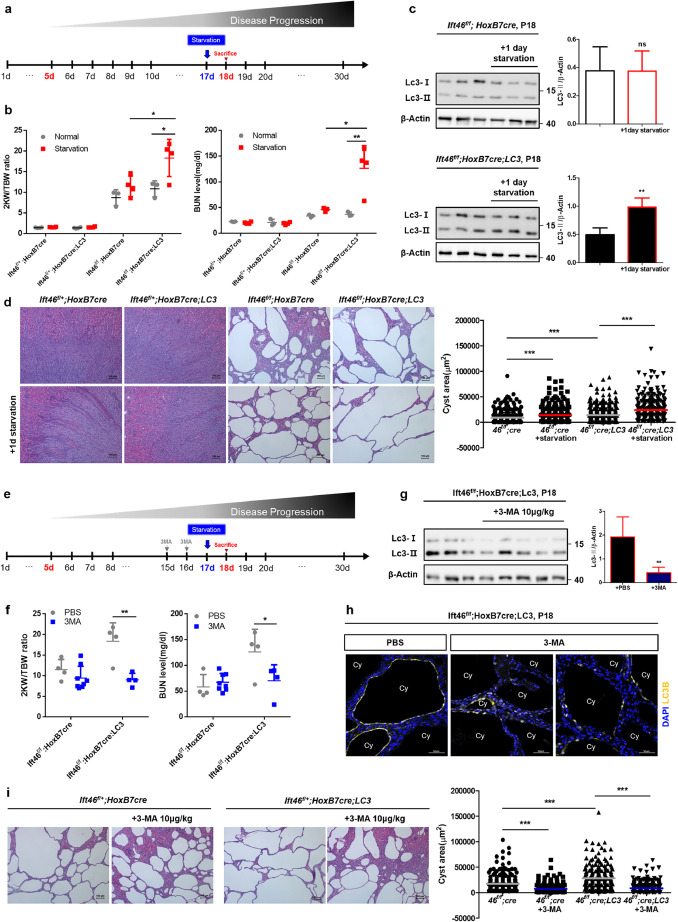
Fig. 4 (a) Schedule for starving mice to stimulate autophagy in Ift46flox/flox; HoxB7-Cre mice with or without Lc3 overexpression. (b) Testing renal function based on the ratio of the weight of two kidneys (2KW) to the total body weight (TBW) and blood urea nitrogen (BUN) level. (c) Immunoblotting analysis shows changes in Lc3 level in Ift46flox/flox; HoxB7-Cre mice with or without Lc3 overexpression after 1-day starvation. (d) Haematoxylin and eosin (H&E)-stained sections of Ift46flox/flox; HoxB7-Cre mice with or without Lc3 overexpression after 1-day starvation. Scale bar, 100 μm. Cyst area was quantified by Image J program. Data are shown as mean ± SD. (e) Schedule for 3-methyladenine (3-MA) injection into Ift46flox/flox; HoxB7-Cre mice with or without Lc3 overexpression. (f) Change in the 2KW/TBW ratio and BUN level. (g) Reduced Lc3 level in Ift46flox/flox; HoxB7-Cre; Lc3 mice injected with 3-MA. (h) Expression and localization of LC3 in cystic renal tissues of control or experimental groups. Scale bar, 50 μm. (i) H&E-stained sections of Ift46flox/flox; HoxB7-Cre mice with or without Lc3 overexpression upon 24 h starvation after 3-MA injection. Scale bar, 100 μm. Cyst area was quantified by Image J program. Graphs represent data as mean ± SD; n ≥ 3 for each group and P < 0.05 was considered statistically significant (* P < 0.05, ** P < 0.01, *** P < 0.001). .
Image
Figure Caption
Acknowledgments
This image is the copyrighted work of the attributed author or publisher, and
ZFIN has permission only to display this image to its users.
Additional permissions should be obtained from the applicable author or publisher of the image.
Full text @ EBioMedicine

