
Fig. 5
- ID
- ZDB-FIG-220408-5
- Publication
- Lee et al., 2020 - Autophagy induction promotes renal cyst growth in polycystic kidney disease
- Other Figures
- All Figure Page
- Back to All Figure Page
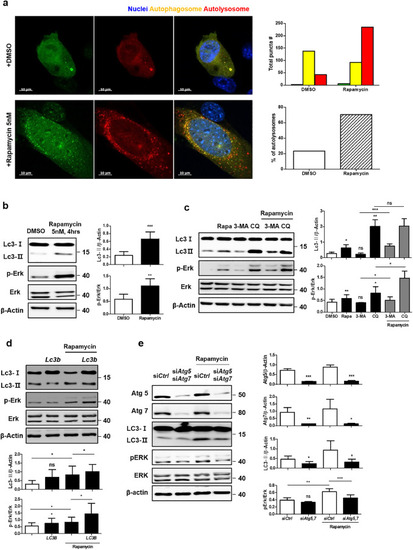
(a) Ratio of autophagosomes fused with lysosomes after 5 nM rapamycin treatment for 4 h. Scale bar, 10 μm. (b) Change in Erk phosphorylation with 5 nM rapamycin treatment for 4 h. (c) Effect of autophagy inhibitors including 3-methyladenine (3-MA) (1 mM) and chloroquine (CQ) (50 μM) on Erk phosphorylation. (d) Increase in Erk phosphorylation in Lc3-overexpressed cells with rapamycin treatment (5 nM, 4 h). (e) Decrease in Erk phosphorylation in Atg5- and Atg7-silenced cells with rapamycin treatment. All data were obtained from a minimum of three independent experiments. Statistical analysis performed using one-tailed t-tests, and P < 0.05 was considered statistically significant (* P < 0.05, ** P < 0.01, *** P < 0.001). |