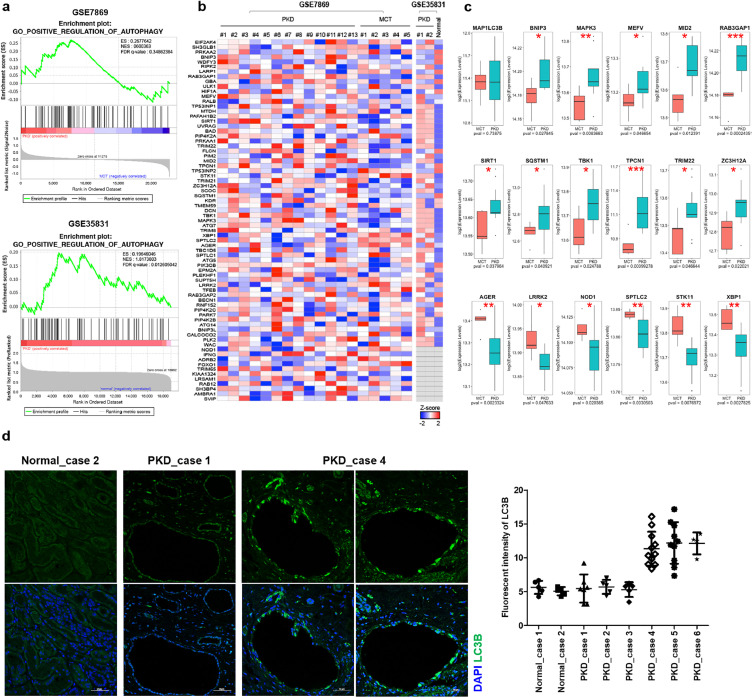
Fig. 1 (a) Gene set enrichment analysis of 75 autophagy-related genes between ADPKD and control groups. (b) Heatmaps of genes that are from Fig. 1a. in each sample. (c) Expression levels of MAP1LC3B and other significantly altered genes from GSE7869 involved in positive regulation of autophagy. Statistical analysis performed using t-tests, and P < 0.05 was considered statistically significant (* P < 0.05, ** P < 0.01, *** P < 0.001). (d) Immunofluorescent staining of human kidney tissues with or without PKD for LC3B. Fluorescence intensity of the signals was quantified by green histogram analyses using Image J program.(For interpretation of the references to color in this figure legend, the reader is referred to the web version of this article.)
Image
Figure Caption
Acknowledgments
This image is the copyrighted work of the attributed author or publisher, and
ZFIN has permission only to display this image to its users.
Additional permissions should be obtained from the applicable author or publisher of the image.
Full text @ EBioMedicine

