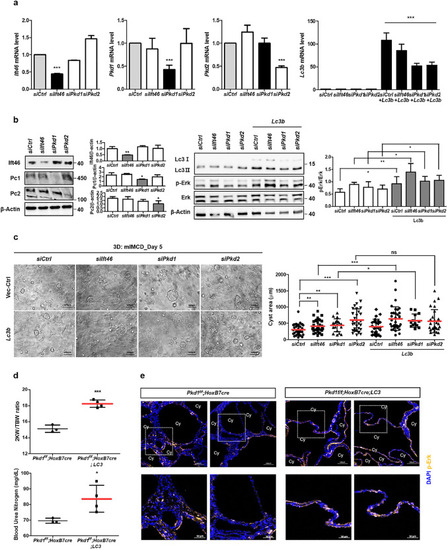
Fig. 6
- ID
- ZDB-FIG-220408-6
- Publication
- Lee et al., 2020 - Autophagy induction promotes renal cyst growth in polycystic kidney disease
- Other Figures
- All Figure Page
- Back to All Figure Page
|
(a) Screening of mRNA expression level after transfection of Ift46 siRNA, Pkd1 siRNA, Pkd2 siRNA or Lc3. (b) Changes in expression of the proteins including Ift46, Pc-1, Pc-2, and Lc3 and Erk phosphorylation. (c) Cysts observed by in vitro 3D culture after increasing Lc3 expression and counts of in vitro cystic area for each group. Graphs represent data as mean ± SD; n > 20 for each group. (d) Changes of the ratio of the weight of two kidneys (2KW) to the total body weight (TBW) and blood urea nitrogen (BUN) level in Pkd1flox/flox; HoxB7-Cre; Lc3 mice. (e) Fluorescent staining of phosphorylated Erk in kidney tissues. Lower panels are enlarged from upper ones. Scale bar, 100 μm for images with high magnification and 50 μm for zoom-in images. Graphs represent data as mean ± SD; n ≥ 3 for each group and P < 0.05 was considered statistically significant (* P < 0.05, ** P < 0.01, *** P < 0.001). |

