FIGURE SUMMARY
Title

Loss of Deacetylation Enzymes Hdac6 and Sirt2 Promotes Acetylation of Cytoplasmic Tubulin, but Suppresses Axonemal Acetylation in Zebrafish Cilia

Authors
Łysyganicz, P.K., Pooranachandran, N., Liu, X., Adamson, K.I., Zielonka, K., Elworthy, S., van Eeden, F.J., Grierson, A.J., Malicki, J.J.
Source
Full text @ Front Cell Dev Biol

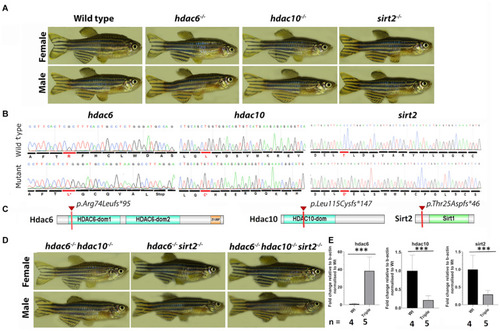
1.5-year-old zebrafish do not display any obvious external phenotype. (A) Pictures of single mutant fish were taken at 1.5 year – single mutation did not cause any visible abnormalities. (B) Comparison of wild type and mutated sequences for hdac6 and hdac10 and sirt2 genes, the first changed amino acid caused by frameshift is indicated in red. (C) Schematic representation of proteins of interest – the red mark shows the premature stop codon caused by the mutation. (D) External phenotypes of double mutants and triple mutants. (E) qPCR results showing expression levels for hdac6, hdac10, and sirt2, relative to b-actin level and normalized to wild type (t-test ***p < 0.005).

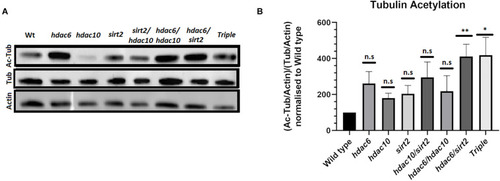
Level of tubulin acetylation in adult fish eyes.
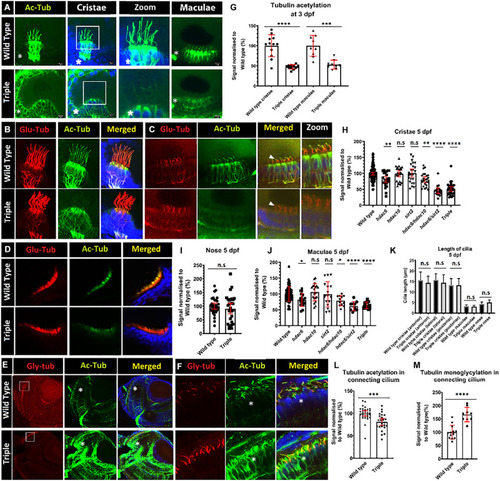
 (A) Western blot showing changes in tubulin acetylation in hdac mutants. (B) Quantification of Western blot signals normalized to actin loading controls (Mean with SEM n = 4. One-way ANOVA *p < 0.05, **p < 0.01). ns, no significant.

Decrease of acetylation in cilia in hdac mutants. (A) Comparison of levels of tubulin acetylation (green) between 3 dpf wild-type embryos and triple mutant embryos in cristae and macule. Squares shows zoomed in areas. (B–D) Double staining for acetylated (green) and glutamylated (red) tubulin, 5 dpf of wild type and triple mutants. (B) cristae (C) macule, and (D) nose. (E) Increased tubulin acetylation (green) of cell bodies in the retina of 5 dpf embryos, and increased levels of mono-glycylation in a subset of cilia (red). (F) Zoom of connecting cilia increased mono-glycylation as well as a lower level of acetylation in the triple mutants. (G) Level of tubulin acetylation in cilia in wild type and triple mutants, normalized to wild type, for cristae and macule of 3 dpf embryos. (I) Unaffected level of acetylation in nose cilia. Change of cristae (H) macule (J) and cilia tubulin acetylation in hdac6, hdac10, sirt2, hdac6/hdac10, hdac6/sirt2, and triple mutants. (K) Comparison of cilia length between wild type and triple mutants in cristae (anterior and lateral posterior) macule and nose. (L) Decrease in connecting cilium axoneme acetylation in photoreceptors in triple mutants and M) increase in tubulin mono-glycylation in triple mutant cilia. Asterisks show increased level of tubulin acetylation in cell bodies. [Mean with 95% CI. (G,I,L,M)t-test *p < 0.05, **p < 0.01, ***p < 0.005, ****p < 0.0001]. ns, no significant. [(H,J,K) one-way ANOVA *p < 0.05, **p < 0.01, ***p < 0.005, ****p < 0.0001]. ns, no significant.

Chemical inhibition of Hdac6. (A) Effects of 72-h treatment with 5 μM CAY-10603 hdac6 inhibitor and hdac6-/- mutation on tubulin acetylation in cristae cilia of 3 dpf old embryo. (B) Tubulin acetylation level normalized to wt. Arrowheads point cilia. (t-test ****p < 0.0001. ns, no significant. nwt = 32 nhdac6 = 17 nCAY10603 = 19).

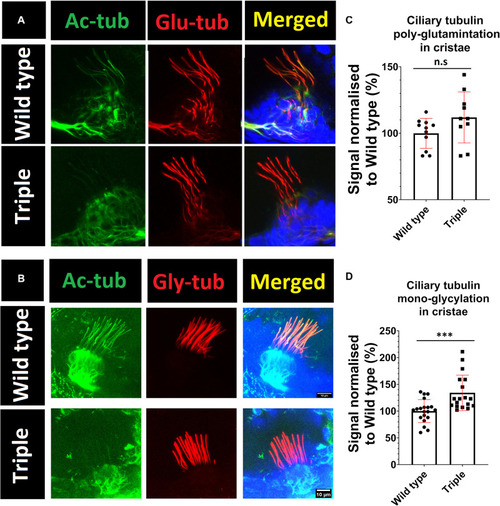
Increase in mono-glycylation, but not poly-glutamination, of tubulin in triple mutant cilia. Green acetylated tubulin, red (A) poly-glutamylated tubulin (B) mono-glycylated tubulin Blue DAPI. (C,D) signals normalized to wild type. t-test ***p < 0.05. ns, no significant.

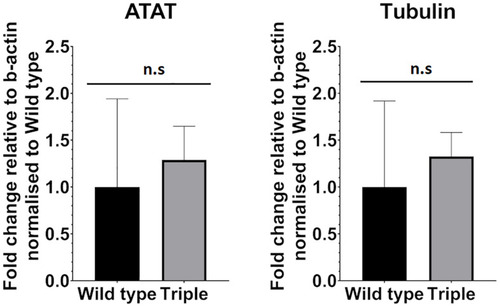
ATAT-1 and Tubulin mRNA expression levels relative to b-actin expression in Wild type and triple mutants. (nwt = 4 ntri = 6 mean with 95% CI.). ns, no significant.

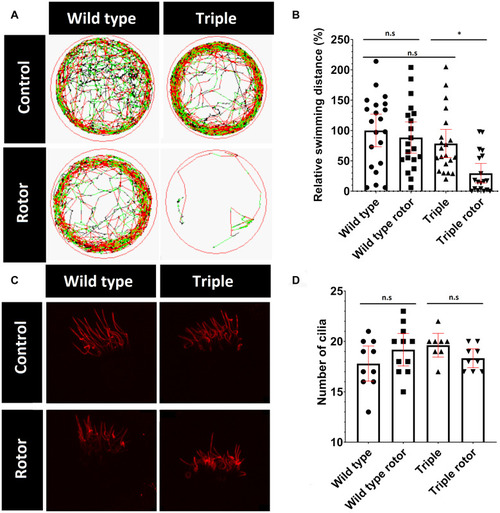
Change in mutant behavior. (A) Tracks of swimming patterns of Wild type and Triple mutant fish treated and untreated with disorientating stimulus. Black lines correspond to slow swimming (<5 mm/s), green lines indicate medium speed (5–10 mm/s) and red lines indicate fast swimming (>10 mm/s). The figure shows a representative swimming pattern of one larvae. (B) Swimming distance normalized to swimming distance by non-treated wild types. (C) TAP952 stained cilia in cristae of treated and untreated fish. (D) Number of cilia in cristae (mean with 95% CI. T-test *p < 0.05). ns, no significant.

Acknowledgments
This image is the copyrighted work of the attributed author or publisher, and ZFIN has permission only to display this image to its users. Additional permissions should be obtained from the applicable author or publisher of the image. Full text @ Front Cell Dev Biol