
- Title
-
Loss of Wnt16 Leads to Skeletal Deformities and Downregulation of Bone Developmental Pathway in Zebrafish
- Authors
- Qu, X., Liao, M., Liu, W., Cai, Y., Yi, Q., Long, J., Tan, L., Deng, Y., Deng, H., Chen, X.
- Source
- Full text @ Int. J. Mol. Sci.
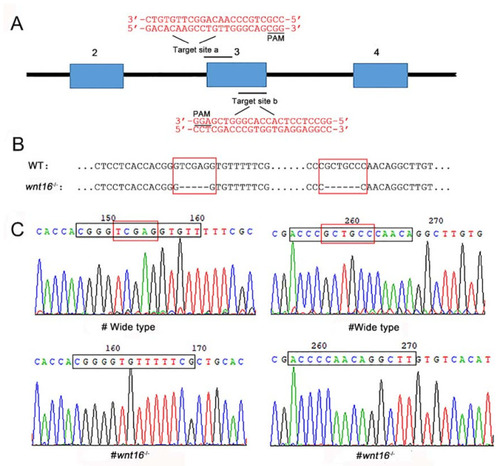
Generation of wnt16 mutant zebrafish with the CRISPR/Cas9 system. (A) Schematic diagram of the target site in the zebrafish wnt16 genome. (B) Sequence alignment between wildtype (WT) and wnt16−/− mutant. (C) Sequencing maps of WT and wnt16−/− zebrafish. Black frames: sequences of the target site. Red frames: TCGAG and GCTGCC in WT. Note the 11 bp (TCGAG and GCTGCC) deletion in wnt16−/−. |
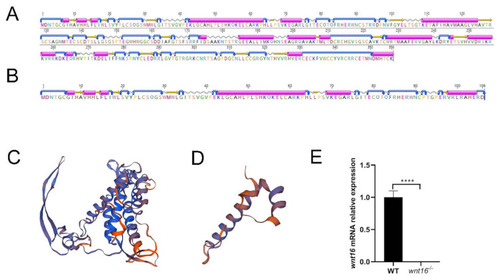
Structure prediction of wnt16 protein and qRT-PCR verification. (A,B) Secondary structure prediction in WT and wnt16−/− zebrafish (purple cylinder indicates alpha helix, yellow arrow indicates beta strand, silver wavy line indicates coil, and blue turning arrow indicates turn). (C,D) Tertiary structure prediction in WT and wnt16−/− zebrafish. (E) qRT-PCR analysis of 2dpf WT and wnt16−/− larvae, showing a statistically significant decrease of wnt16 expression in wnt16−/− zebrafish. The results are represented as means ± SEM, **** p < 0.001. |
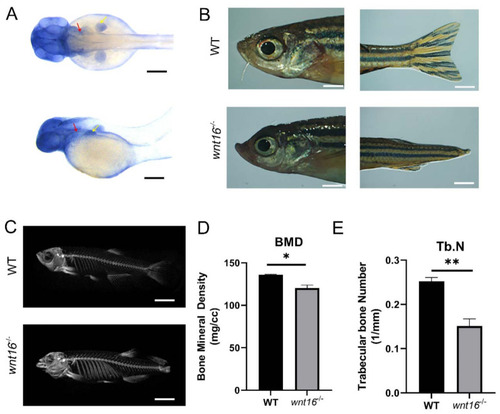
Images of zebrafish generated by WISH, light microscopy, and micro-CT and skeletal statistical analysis. (A) Images of whole-mount in situ hybridisation with wnt16 mRNA probes in WT larvae at 48 hpf. Colour intensity is proportional to the expression level of wnt16 gene. Arrowheads indicate relevant domains of expression. Yellow, pectoral fin bud (pfb); red, operculum (op). (B) Representatives of adult WT and wnt16−/− mutant zebrafish are shown. Apparent abnormality was observed in the head and tail of wnt16−/− mutant zebrafish. (C) Micro-CT scanning of WT and wnt16−/− mutant zebrafish skeleton. Obvious abnormality was observed in the mandible and spine of wnt16−/− mutant zebrafish. (D,E) Statistical analysis of BMD (D) and Tb.N (E) in WT and wnt16−/− zebrafish. Note that BMD and Tb.N value decreased in the wnt16−/− group. The results are represented as means ± SEM, * p < 0.05, ** p < 0.01. Scale bar: 150 μm (A); 2 mm (B); 6 mm (C). |
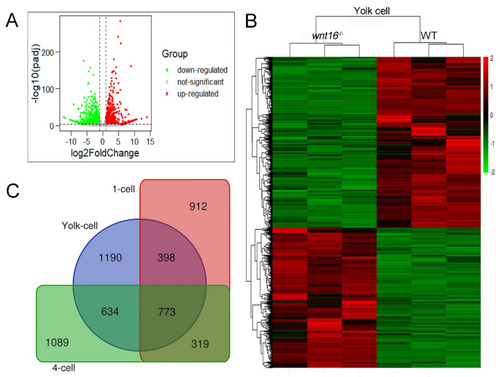
Clustering of differentially expressed genes (DEGs). (A) The volcano graph was performed to show DEGs in the yolk-cell period. The red part indicates up-regulated genes and the green part indicates down-regulated genes. (B) The overall distribution of DEGs between the WT group and wnt16−/− group in the yolk-cell period. Red and green represent up-regulated and down-regulated changes, respectively, in the clustering analysis. The color intensity is directly proportional to the change. (C) Venn diagram of the co-expressed differential genes of three groups. |
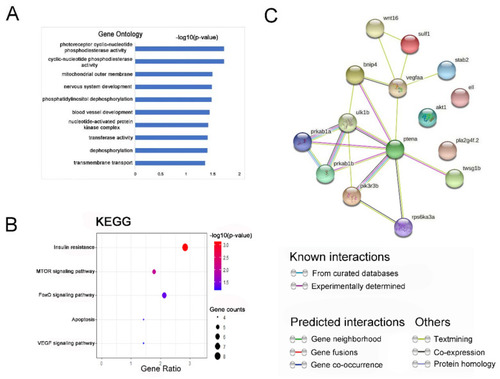
Gene ontology (GO) enrichment and Kyoto Encyclopedia of Genes and Genomes (KEGG) signaling pathway analysis of co-expression down-regulated DEGs. (A) GO analysis of co-expression down-regulated genes; bar plot shows the top ten enrichment score (−log10 (p-value)) of DEGs involving biological process, cellular component, and molecular function. (B) The significant changes in the KEGG pathway of co-expressed down-regulated genes. The bubble graph shows the enrichment score (−log10 (p-value)) of the significant pathway. The size of the circle represents the number of enriched DEGs. p-value was represented by a color scale, and the statistical significance increased from blue (relatively lower significance) to red (relatively higher significance). (C) Protein–protein interaction network of these fifteen DEGs and wnt16. Nodes represent genes, lines represent the interaction of proteins with genes, and the results within the nodes represent the structure of proteins. Line color represents evidence of the interaction between the proteins. |
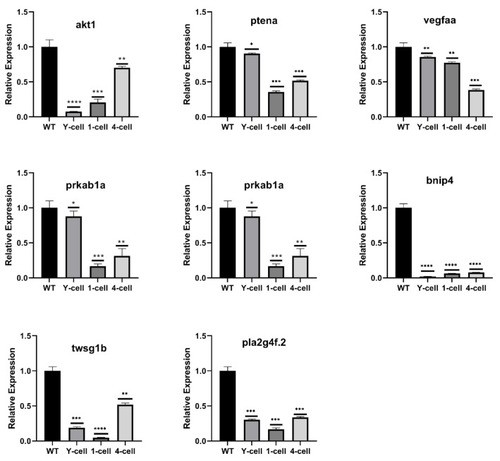
Validation of RNA-Seq data by qRT-PCR. Eight significantly down-regulated DEGs highlighted in GO enrichment and KEGG signaling pathway related to skeletal development. All the selected DEGs showed the same expression pattern in both RNA-Seq and qRT-PCR analysis. The results are represented as means ± SEM, * p < 0.05, ** p < 0.01, *** p < 0.002, **** p < 0.001. |