
IMAGE
Figure 6
- ID
- ZDB-IMAGE-210712-49
- Genes
- Publication
- Qu et al., 2021 - Loss of Wnt16 Leads to Skeletal Deformities and Downregulation of Bone Developmental Pathway in Zebrafish
- All Figures
- Figures for Qu et al., 2021
Image
|
Figure Caption
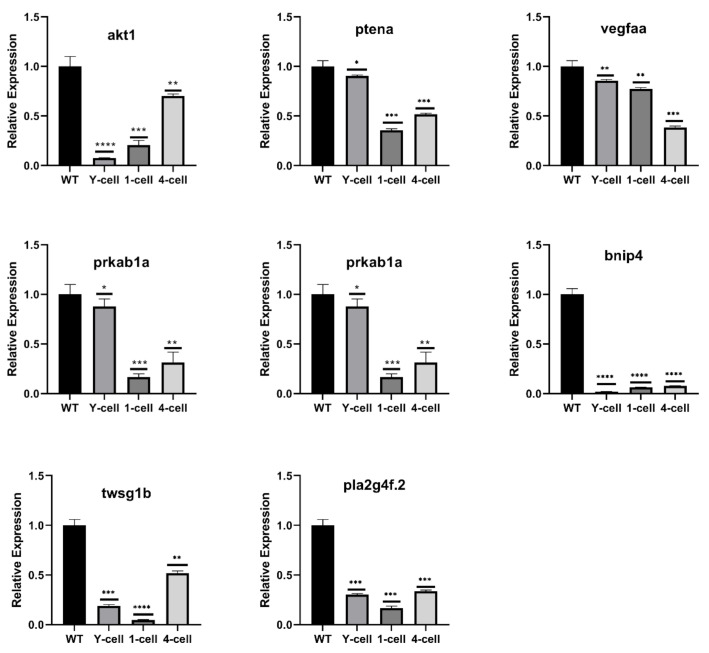
Figure 6 Validation of RNA-Seq data by qRT-PCR. Eight significantly down-regulated DEGs highlighted in GO enrichment and KEGG signaling pathway related to skeletal development. All the selected DEGs showed the same expression pattern in both RNA-Seq and qRT-PCR analysis. The results are represented as means ± SEM, * p < 0.05, ** p < 0.01, *** p < 0.002, **** p < 0.001.
Figure Data
Acknowledgments
This image is the copyrighted work of the attributed author or publisher, and
ZFIN has permission only to display this image to its users.
Additional permissions should be obtained from the applicable author or publisher of the image.
Full text @ Int. J. Mol. Sci.