
FIGURE
Figure 1
- ID
- ZDB-FIG-210712-44
- Publication
- Qu et al., 2021 - Loss of Wnt16 Leads to Skeletal Deformities and Downregulation of Bone Developmental Pathway in Zebrafish
- Other Figures
- All Figure Page
- Back to All Figure Page
Figure 1
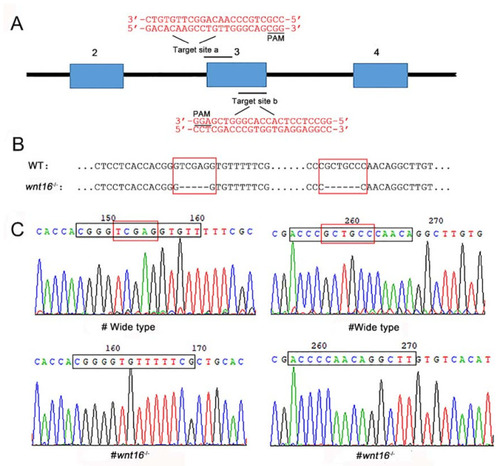
Generation of wnt16 mutant zebrafish with the CRISPR/Cas9 system. (A) Schematic diagram of the target site in the zebrafish wnt16 genome. (B) Sequence alignment between wildtype (WT) and wnt16−/− mutant. (C) Sequencing maps of WT and wnt16−/− zebrafish. Black frames: sequences of the target site. Red frames: TCGAG and GCTGCC in WT. Note the 11 bp (TCGAG and GCTGCC) deletion in wnt16−/−. |
Expression Data
Expression Detail
Antibody Labeling
Phenotype Data
Phenotype Detail
Acknowledgments
This image is the copyrighted work of the attributed author or publisher, and
ZFIN has permission only to display this image to its users.
Additional permissions should be obtained from the applicable author or publisher of the image.
Full text @ Int. J. Mol. Sci.