
FIGURE
Figure 4
- ID
- ZDB-FIG-210712-47
- Publication
- Qu et al., 2021 - Loss of Wnt16 Leads to Skeletal Deformities and Downregulation of Bone Developmental Pathway in Zebrafish
- Other Figures
- All Figure Page
- Back to All Figure Page
Figure 4
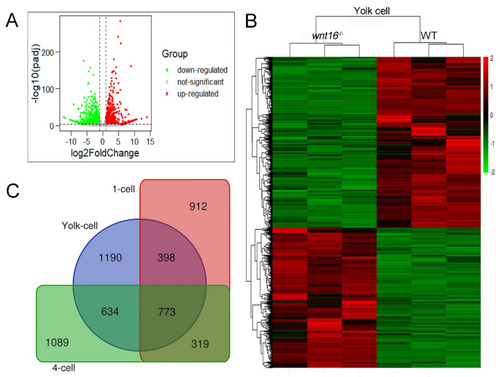
Clustering of differentially expressed genes (DEGs). (A) The volcano graph was performed to show DEGs in the yolk-cell period. The red part indicates up-regulated genes and the green part indicates down-regulated genes. (B) The overall distribution of DEGs between the WT group and wnt16−/− group in the yolk-cell period. Red and green represent up-regulated and down-regulated changes, respectively, in the clustering analysis. The color intensity is directly proportional to the change. (C) Venn diagram of the co-expressed differential genes of three groups. |
Expression Data
Expression Detail
Antibody Labeling
Phenotype Data
Phenotype Detail
Acknowledgments
This image is the copyrighted work of the attributed author or publisher, and
ZFIN has permission only to display this image to its users.
Additional permissions should be obtained from the applicable author or publisher of the image.
Full text @ Int. J. Mol. Sci.