
FIGURE
Figure 2
- ID
- ZDB-FIG-210712-45
- Publication
- Qu et al., 2021 - Loss of Wnt16 Leads to Skeletal Deformities and Downregulation of Bone Developmental Pathway in Zebrafish
- Other Figures
- All Figure Page
- Back to All Figure Page
Figure 2
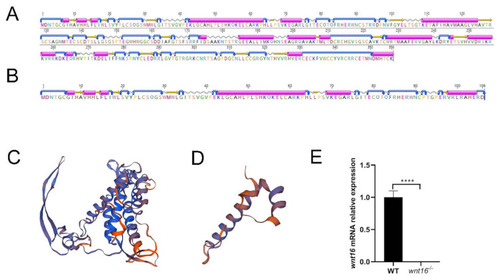
Structure prediction of wnt16 protein and qRT-PCR verification. (A,B) Secondary structure prediction in WT and wnt16−/− zebrafish (purple cylinder indicates alpha helix, yellow arrow indicates beta strand, silver wavy line indicates coil, and blue turning arrow indicates turn). (C,D) Tertiary structure prediction in WT and wnt16−/− zebrafish. (E) qRT-PCR analysis of 2dpf WT and wnt16−/− larvae, showing a statistically significant decrease of wnt16 expression in wnt16−/− zebrafish. The results are represented as means ± SEM, **** p < 0.001. |
Expression Data
| Gene: | |
|---|---|
| Fish: | |
| Anatomical Term: | |
| Stage: | Long-pec |
Expression Detail
Antibody Labeling
Phenotype Data
| Fish: | |
|---|---|
| Observed In: | |
| Stage: | Long-pec |
Phenotype Detail
Acknowledgments
This image is the copyrighted work of the attributed author or publisher, and
ZFIN has permission only to display this image to its users.
Additional permissions should be obtained from the applicable author or publisher of the image.
Full text @ Int. J. Mol. Sci.