
- Title
-
Dimethyl fumarate reduces hepatocyte senescence following paracetamol exposure
- Authors
- Meseguer-Ripolles, J., Lucendo-Villarin, B., Tucker, C., Ferreira-Gonzalez, S., Homer, N., Wang, Y., Starkey Lewis, P.J., M Toledo, E., Mellado-Gomez, E., Simpson, J., Flint, O., Jaiswal, H., Beer, N.L., Karlsen, A.E., Forbes, S.J., Dear, J.W., Hughes, J., Hay, D.C.
- Source
- Full text @ iScience
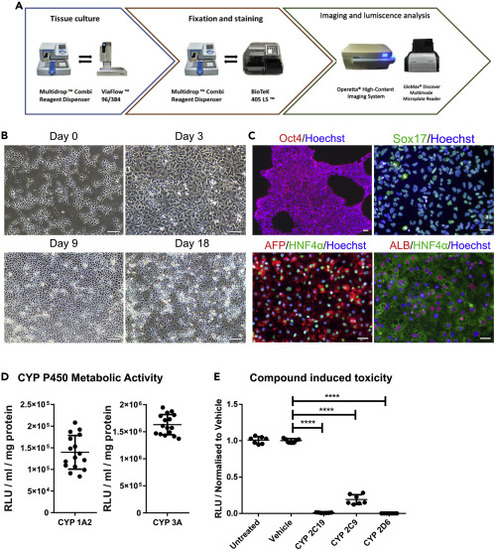
(A) Pipeline overview for automated production of HLCs. (B) Representative images of cellular morphology during HLC differentiation. hPSCs are seeded as single cells and then driven toward definitive endoderm (Day 3). This is followed by hepatoblast specification characterized by cells displaying cobblestone-like morphology (Day 9). Finally, cells are further differentiated to HLCs acquiring polygonal-shape (Day 18). Scale bar represents 100 μm. (C) Immunostaining of the different stages of the differentiation. hPSC cells express the pluripotent marker Oct4 (Day 0). Definitive endoderm marker Sox17 expression was detected at Day 3. Hepatic progenitor specification was evidenced by HNF4α and AFP protein expression (Day 9). Finally, HLC differentiation was evidenced by HNF4α and ALB expression (Day 18). Scale bar represents 50 μm. (D) Basal cytochrome P450 activity of HLCs was determined at Day 18. CYP 3A and CYP 1A2 activity were measured by luminescence, and activity is quoted as relative light units (RLUs)/mL per mg of protein. Dot plot represents n = 16. Data are represented as mean ± SEM. (E) Day 18 HLCs were exposed to BMS compounds (48 hr) with specificity for particular cytochrome P450 enzymes. Following incubation, ATP levels were quantified. ATP levels are represented as relative light units (RLUs) normalized to the vehicle. Dot plot represents n = 6. One-way ANOVA test and post-hoc Tukey multiple-comparison test was used. ∗∗∗∗p < 0.0001. Data are represented as mean ± SEM. |
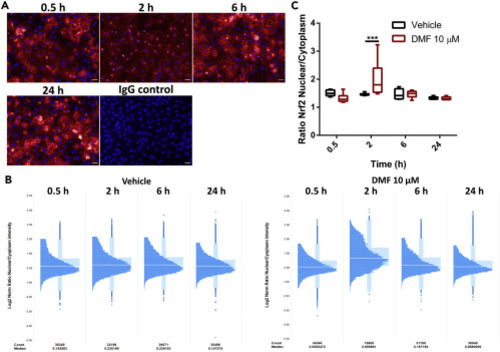
(A) Nrf2 nuclear translocation following DMF administration. Day 18 HLCs were treated with 10 μM DMF for 0.5,2, 6, and 24 hr. After treatment cells were immunostained for Nrf2. Representative images from each time point are provided. Scale bar represents 50 μm. (B) Single-cell analysis of Nrf2 dynamics upon DMF or vehicle administration. Ratio of Nrf2 nuclear translocation following DMF administration. Box plot, where each timepoint is represented in a box plot with a histogram to show the sample distribution. The white line represents the median of the sample. (C) Nuclear localization of the Nrf2 per time point and condition. n = 4. One-way ANOVA test and post-hoc Tukey multiple-comparison test was used ∗∗∗p < 0.001. Box plot were whiskers represent Min to Max. |

(A) Nrf2 target gene expression following DMF (10 μM) or H2O2 (1mM) treatment for 3h. The three target genes tested, HMOX1, NQO1, and GSR were upregulated following treatment with either DMF or H2O2. HMOX1 = heme oxygenase 1, NQO1 = NAD(P)H quinone dehydrogenase 1, GSR = glutathione-disulfide reductase. n = 3. Data ploteed as a dot plot with mean ± SEM. One-way ANOVA test and post-hoc Tukey multiple-comparison test was used. ∗p < 0.05, ∗∗p < 0.01, ∗∗∗p < 0.001. (B) Pre-treatment of HLCs with DMF (10 μM), NAC (1 mM) or combination of the two for 24 hr prior to the administration of paracetamol (30mM) for 24 hr, shows increased levels of ATP compared to paracetamol treatment alone. n = 6. One-way ANOVA test and post-hoc Tukey multiple-comparison test was used. ∗∗∗∗p < 0.0001. Box plot were whiskers represent Min to Max. (C) Post-treatment of DMF (10 μM) after a 24-hr incubation with paracetamol (30mM) shows increased levels of ATP when compared to paracetamol treatment alone. n = 6. One-way ANOVA test and post-hoc Tukey multiple-comparison test was used.∗p < 0.05, ∗∗p < 0.01, ∗∗∗∗p < 0.0001. Box plot were whiskers represent Min to Max. (D) DMF pre-treatment assessment by Cell Paint profiling. The PCA plot takes account of the different features and compares the different populations. |

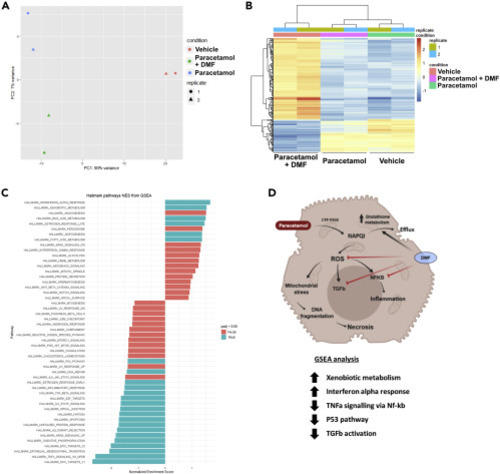
(A) PCA plot of HLC treatment and clustering. The colors are used for the different groups, and the shape for each replicate. (B) Replicate variability assessment using heatmap visualization in the pre-treatment group. (C) GSEA-MSigDB enrichment analysis from HLCs pre-treatment RNA-seq data set. The graph displays the normalized enrichment score from the 50 hallmarks, and these hallmarks are representative of important biological processes. Labeled in blue are labeled are the hallmarks with an adjusted p value <0.05. (D) Proposed mechanism of action of DMF protection following pre-treatment. N = 3 (8 replicates per experiment, 24 replicates in total). |
(A) PCA plot of HLC treatment and clustering. The colors are used for the different groups, and the shape for each replicate. (B) Replicate variability assessment using heatmap visualization in the post-treatment group. (C) GSEA-MSigDB enrichment analysis from HLCs post-treatment RNA-seq data set. The graph displays the normalized enrichment score from the 50 hallmarks, and these hallmarks are representative of important biological processes. Labeled in blue are labeled are the hallmarks with an adjusted p value <0.05. (D) Proposed mechanism of action of DMF protection following post-treatment. N = 2 (8 replicates combined per experiment, 16 replicates in total). |
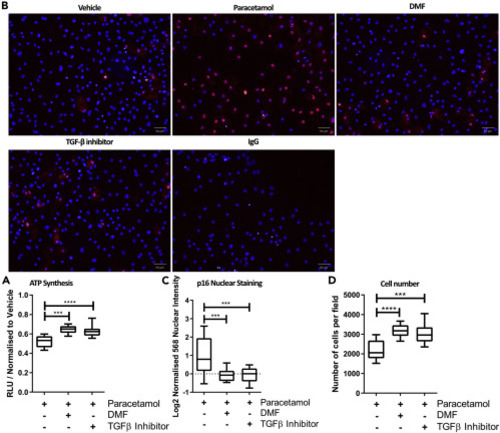
(A) 24 hr treatment of DMF (10 μM) or SB-431542 (10 μM), following 24 hparacetamol (30 mM) exposure, improved ATP levels in HLCs. n = 12. One-way ANOVA test and post-hoc Tukey multiple-comparison test was used. ∗∗p < 0.01, ∗∗∗p < 0.001. Box plot were whiskers represent Min to Max. (B) 6 hr treatment of DMF (10 μM) or SB-431542 (10μM) following 24 hr paracetamol (30 mM) exposure reduces p16 expression and nuclear staining in HLCs. Scale bar represents 50 μm. (C) Single-cell image analysis quantification of p16 shows a significant increase of p16 nuclear intensity when HLCs are treated with paracetamol (30 mM) alone. n = >6. One-way ANOVA test and post-hoc Tukey multiple-comparison test was used. ∗∗∗p < 0.001. Box plot were whiskers represent Min to Max. (D) Treatment with DMF (10 μM) or SB-431542 (10 μM) for 6 hr following 24hr paracetamol (30 mM) exposure for 24 hr significantly prevented cell loss. n = >6. One-way ANOVA test and post-hoc Tukey multiple-comparison test was used. ∗∗∗p < 0.001 ∗∗∗∗p < 0.0001. Scale bar represents 50μm. Box plot were whiskers represent Min to Max. |
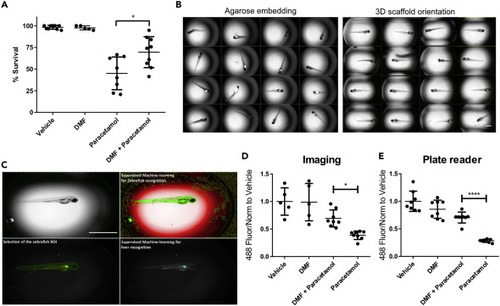
(A) WIK-larvae were treated with vehicle, and DMF (2.5uM) for 48 hr. The other experimental groups were treated with either vehicle or DMF (2.5uM) for 6 hr, prior to treatment with paracetamol (10mM) for a further 42 hr. Each dot represents the survival percentage of a biological replicate (30–35 zebrafish). Data ploteed as a dot plot with mean ± SEM. n=>5. One-way ANOVA test and post-hoc Tukey multiple-comparison test was used. ∗p < 0.05. (B) Methods for larvae orientation for live imaging. Plates that employ manual agarose embedding, demonstrate random distributions of larvae with focal variation. Plates prepared using the 3D scaffold orientation tool generates a reproducible system in terms of larvae position, focal plane, and spatial orientation. Scale bar represents 1 mm. (C) Supervised machine learning was used for automatic zebrafish recognition. Pixel texture was used to exclude background (red) from zebrafish (green) following refinement by size and shape. Selection of ROI based on shape and size of the larvae was used to distinguish between larvae and background. Next, supervised machine learning was used for GFP-positive liver recognition. Scale bar represents 1 mm. (D) Loss of GFP signal following 42 hr of paracetamol exposure was quantified using high content imaging. Wild-type lines were used to detect any potential issues with autofluorescence. n=>6. One-way ANOVA test and post-hoc Tukey multiple-comparison test was used. ∗p < 0.05. Data ploteed as a dot plot with mean ± SEM. (E) Loss of GFP signal following 42 hr of paracetamol exposure was measured using a plate reader. n=>3. One-way ANOVA test and post-hoc Tukey multiple-comparison test was used. ∗∗∗∗p < 0.0001. Data ploteed as a dot plot with mean ± SEM. |

Graph represents the normalized enrichment score from the 50 hallmarks, and these hallmarks are representative of important biological processes. This score is obtained by combining all the gene expression information when comparing zebrafish larvae treated with paracetamol + DMF vs paracetamol. In blue are labeled the hallmarks with an adjusted p value <0.05. |