
Fig. 2
- ID
- ZDB-FIG-220107-21
- Publication
- Meseguer-Ripolles et al., 2021 - Dimethyl fumarate reduces hepatocyte senescence following paracetamol exposure
- Other Figures
- All Figure Page
- Back to All Figure Page
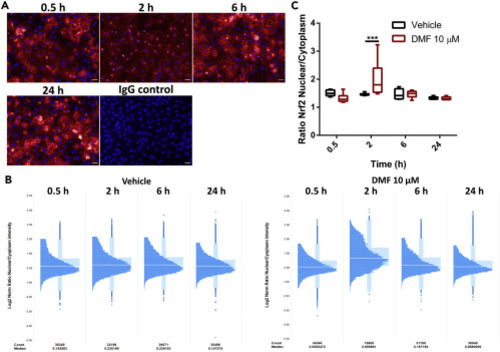
(A) Nrf2 nuclear translocation following DMF administration. Day 18 HLCs were treated with 10 μM DMF for 0.5,2, 6, and 24 hr. After treatment cells were immunostained for Nrf2. Representative images from each time point are provided. Scale bar represents 50 μm. (B) Single-cell analysis of Nrf2 dynamics upon DMF or vehicle administration. Ratio of Nrf2 nuclear translocation following DMF administration. Box plot, where each timepoint is represented in a box plot with a histogram to show the sample distribution. The white line represents the median of the sample. (C) Nuclear localization of the Nrf2 per time point and condition. n = 4. One-way ANOVA test and post-hoc Tukey multiple-comparison test was used ∗∗∗p < 0.001. Box plot were whiskers represent Min to Max. |