
Image
|
Figure Caption
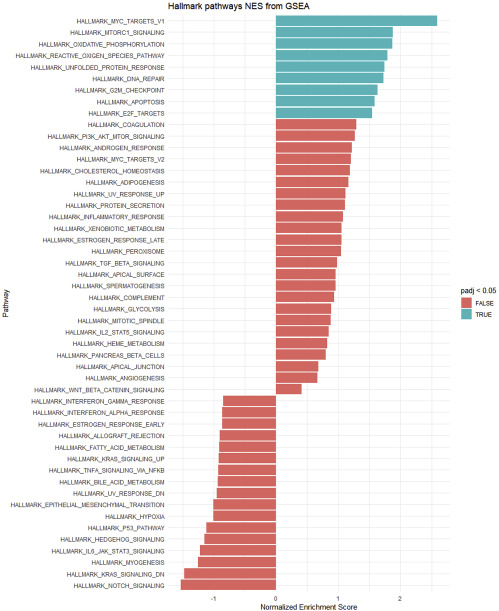
Fig. 8 Graph represents the normalized enrichment score from the 50 hallmarks, and these hallmarks are representative of important biological processes. This score is obtained by combining all the gene expression information when comparing zebrafish larvae treated with paracetamol + DMF vs paracetamol. In blue are labeled the hallmarks with an adjusted p value <0.05.
Acknowledgments
This image is the copyrighted work of the attributed author or publisher, and
ZFIN has permission only to display this image to its users.
Additional permissions should be obtained from the applicable author or publisher of the image.
Full text @ iScience