
|
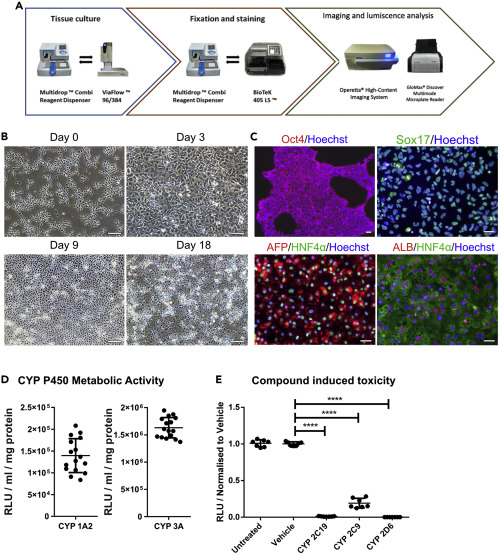
Fig. 1 (A) Pipeline overview for automated production of HLCs. (B) Representative images of cellular morphology during HLC differentiation. hPSCs are seeded as single cells and then driven toward definitive endoderm (Day 3). This is followed by hepatoblast specification characterized by cells displaying cobblestone-like morphology (Day 9). Finally, cells are further differentiated to HLCs acquiring polygonal-shape (Day 18). Scale bar represents 100 μm. (C) Immunostaining of the different stages of the differentiation. hPSC cells express the pluripotent marker Oct4 (Day 0). Definitive endoderm marker Sox17 expression was detected at Day 3. Hepatic progenitor specification was evidenced by HNF4α and AFP protein expression (Day 9). Finally, HLC differentiation was evidenced by HNF4α and ALB expression (Day 18). Scale bar represents 50 μm. (D) Basal cytochrome P450 activity of HLCs was determined at Day 18. CYP 3A and CYP 1A2 activity were measured by luminescence, and activity is quoted as relative light units (RLUs)/mL per mg of protein. Dot plot represents n = 16. Data are represented as mean ± SEM. (E) Day 18 HLCs were exposed to BMS compounds (48 hr) with specificity for particular cytochrome P450 enzymes. Following incubation, ATP levels were quantified. ATP levels are represented as relative light units (RLUs) normalized to the vehicle. Dot plot represents n = 6. One-way ANOVA test and post-hoc Tukey multiple-comparison test was used. ∗∗∗∗p < 0.0001. Data are represented as mean ± SEM.