
|
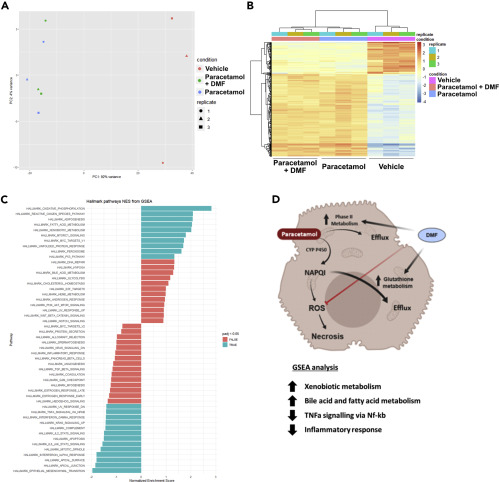
Fig. 4 (A) PCA plot of HLC treatment and clustering. The colors are used for the different groups, and the shape for each replicate. (B) Replicate variability assessment using heatmap visualization in the pre-treatment group. (C) GSEA-MSigDB enrichment analysis from HLCs pre-treatment RNA-seq data set. The graph displays the normalized enrichment score from the 50 hallmarks, and these hallmarks are representative of important biological processes. Labeled in blue are labeled are the hallmarks with an adjusted p value <0.05. (D) Proposed mechanism of action of DMF protection following pre-treatment. N = 3 (8 replicates per experiment, 24 replicates in total).