
- Title
-
Synthetic resin acid derivatives selectively open the hKV 7.2/7.3 channel and prevent epileptic seizures
- Authors
- Ottosson, N.E., Silverå Ejneby, M., Wu, X., Estrada-Mondragón, A., Nilsson, M., Karlsson, U., Schupp, M., Rognant, S., Jepps, T.A., Konradsson, P., Elinder, F.
- Source
- Full text @ Epilepsia
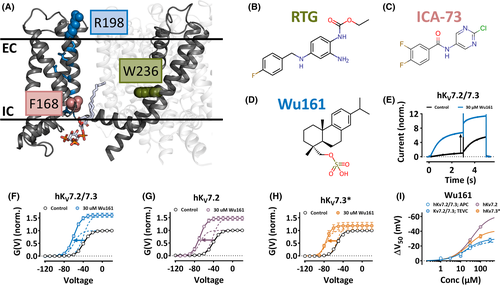
Wu161 opens homo- and heterotetramers of hKV7.2 and hKV7.3. A, Side view of an hKV7.2 channel subunit (based on Protein Data Bank 6V01) in the presence of phosphatidylinositol 4,5-biphosphate (PIP2). EC, extracellular side; IC, intracellular side. Blue sticks, gating charges of S4 (R2–R6); blue spheres, gating charge of S4 highlighted in this study (R1 = R198); pink spheres, residue important for the effects of ICA-73 (F168); green spheres, residue important for the effect of RTG (W236). B, Molecular structure of retigabine (RTG). C, Molecular structure of ICA-069673 (ICA-73). D, Molecular structure of Wu161. E, Current traces for hKV7.2/7.3 in control solution and Wu161 as indicated; voltage step 1 = −50 mV; voltage step 2 = −30 mV (tail currents). End of step 1 (as well as instantaneous current at step 2) was increased by a factor of 6.0 (black arrow). F-H, G(V) curves for hKV7.2/7.3 (F), hKV7.2 (G), and hKV7.3* (=hKV7.3[A315T]; H) in control solution or Wu161 as indicated. Data = mean ± SEM. Thick lines (best fit of Equation 2). Dashed lines are decomposed compound effects with respect to isolated ΔV and GMAX effects. Wu161 (30 µM) altered V50. hKV7.2/7.3: V50 = −39.0 ± 1.0 mV, −59.6 ± 0.6 mV, ΔV50 = −20.6 ± 1.4 mV (n = 8). hKV7.2: V50 = −41.1 ± 0.6 mV, −69.4 ± 1.6 mV, ΔV50 = −28.3 ± 1.8 mV (n = 4). hKV7.3* = −52.2 ± 1.5 mV, −76.4 ± 2.7 mV, ΔV50 = −24.2 ± 3.1 mV (n = 5). Wu161 (30 µM) increased GMAX. hKV7.2/7.3: GMAX = 1.6 ± 0.1 (n = 8). hKV7.2: GMAX = 1.6 ± 0.2 (n = 4). hKV7.3*: GMAX = 1.2 ± 0.1 (n = 5). One-way ANOVA was used with Tukey's multiple comparison test and there were no significant differences between the channels for either ΔV50 or ratio of GMAX. I, Concentration-dependence for the effect of Wu161 on ΔV50 for hKV7.2/7.3 (expressed in oocytes [two-electrode voltage clamp, TEVC] and HEK cell line [automated patch clamp, APC]), and hKV7.2 and hKV7.3* (expressed in oocytes) as indicated. Data = mean ± SEM. Equation 3 was fitted to data. hKV7.2/7.3 (oocytes/TEVC): ΔVMAX = −30.3 ± 2.0 mV, EC50 = 19.9 ± 4.3 µM. hKV7.2/7.3 (HEK cells/APC): ΔVMAX = −26.2 ± 6.9 mV, EC50 = 16.8 ± 9.9 µM. hKV7.2: ΔVMAX = −62.9 ± 5.5 mV, EC50 = 36.7 ± 8.7 µM; hKV7.3*: ΔVMAX = −41.8 ± 4.5 mV, EC50 = 24.1 ± 6.8 µM (n = 4–8) |

Retigabine (RTG), ICA-73, and Wu161 open hKV7.2/7.3 or hKV7.2 channels via different binding sites. A, G(V) curves for hKV7.2/7.3 (expressed in Xenopus oocytes) at pH 7.4 in control solution or RTG as indicated. Data = mean ± SEM. Equation 2: V50 = −44.0 ± 0.6 mV, −76.3 ± 0.4 mV, ΔV50 = −32.3 mV (n = 5). B, G(V) curves for hKV7.2[W236L]/hKV7.3[W265L] (expressed in Xenopus oocytes) at pH 7.4 in control, RTG, or Wu161 as indicated. Data = mean ± SEM. Equation 2 for RTG: V50 = −53.6 ± 2.3 mV, −54.1 ± 2.6 mV; ΔV50 = −0.5 ± 0.3 mV (n = 4); Equation 2 for Wu161: V50 = −51.7 ± 1.5 mV, −69.6 ± 1.5 mV, ΔV50 = −17.8 ± 0.4 mV (n = 5). C, ΔV50 values from A, B, and Figure 1F. Data = mean ± SEM. One-way ANOVA was used with Sidak's multiple comparison test. ns, p > .05; ****, p < .0001. D, G(V) curves for hKV7.2 (expressed in Xenopus oocytes) at pH 7.4 in control solution or ICA-73 as indicated. Data = mean ± SEM. Equation 2: V50 = −43.1 ± 0.3 mV (slope factor s = 8.4 ± 0.3), −105.9 ± 2.5 mV (slope factor s = 20.7 ± 3.0 mV), ΔV50 = −62.8 mV (n = 5). E, G(V) curves for hKV7.2[F168L] (expressed in Xenopus oocytes) at pH 7.4 in control, ICA-73, or Wu161 as indicated. Equation 2 fitted to the data points. ICA-73 (30 µM) : V50 = −28.7 ± 2.2 mV, −30.1 ± 2.3 mV, ΔV50 = −1.4 ± 0.7 (n = 4); 30 µM Wu161: V50 = −32.3 ± 1.9 mV, −60.9 ± 2.7 mV, ΔV50 = −28.6 ± 1.6 (n = 8). F, ΔV50 values from D, F, and Figure 1G. Data = mean ± SEM. One-way ANOVA was used with Sidak's multiple comparison test. ns, p > .05; ****, p < .0001. G, G(V) curves for hKV7.2 (expressed in Xenopus oocytes) at pH 7.4 in control or Wu161 as indicated. Data = mean ± SEM. Equation 2: V50 = −41.1 ± 0.6 mV, −69.4 ± 1.6 mV, ΔV50 = −28.3 ± 1.8 mV (n = 4). Same data as in Figure 1G. H, G(V) curves for hKV7.2 [R198Q] (expressed in Xenopus oocytes) at pH 7.4 in control or Wu161 as indicated. Data = mean ± SEM. Equation 2: V50 −91.1 ± 1.2 mV, −104.1 ± 0.7 mV, ΔV50 = −13.3 ± 1.9 (n = 3). (I) ΔV50 values for data shown in G and H. Data = mean ± SEM. Unpaired t test was used. **, p < .01 |
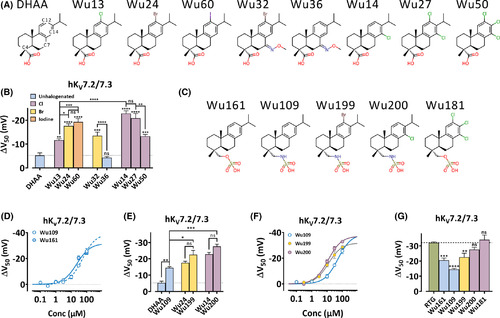
Structural modifications of the resin acid derivatives affects channel activation. A, Molecular structures of dehydroabietic acid (DHAA, including numbering of some carbon atoms) and investigated resin acid derivatives with a carboxyl group. B, G(V) shifts (ΔV50) (hKV7.2/7.3 expressed in Xenopus oocytes) at pH 9 by 30 µM of indicated compound. Data = mean ± SEM. Color coding according to halogenation as indicated. G(V) shifts: DHAA: −5.3 ± 1.1 mV (n = 5); Wu13: −11.6 ± 0.6 mV (n = 6); Wu24: −17.6 ± 0.9 mV (n = 4); Wu60: −19.3 ± 1.4 mV (n = 6); Wu32: −13.6 ± 1.5 mV (n = 4); Wu36: −4.3 ± 0.5 mV (n = 5); Wu14: −22.9 ± 1.1 mV (n = 4); Wu27: −20.9 ± 2.0 mV (n = 5); Wu50: −13.3 ± 0.8 mV (n = 4). One-way ANOVA was used with Sidak's multiple comparison test. For comparison with DHAA (dotted line), the significance is given above each bar. ns, p > .05; *, p < .05; **, p < .01; ***, p < .001; ****, p < .0001. C, Molecular structures of investigated resin acid derivatives with a sulfonyl group. D, Concentration-response for ΔV50 (hKV7.2/7.3 expressed in Xenopus oocytes) at pH 7.4 for Wu109 and Wu161 as indicated. Data = mean ± SEM. Equation 3 for Wu109: ΔVMAX = −38.8 ± 4.5 mV, EC50 = 51.1 ± 12.6 µM, (n = 3–4). Equation 3 for Wu161: ΔVMAX = −31.7 ± 3.0 mV, EC50 = 22.7 ± 5.8 µM, (n = 4–8). E, G(V) shifts (ΔV50) (hKV7.2/7.3 expressed in Xenopus oocytes) at pH 9.0 (30 µM DHAA, Wu24, and Wu14 [for data see B]) or at pH 7.4 (Wu109: −14.5 ± 0.7 mV (n = 6); Wu199: −22.6 ± 2.6 mV (n = 4); Wu200: −27.6 ± 1.4 mV (n = 4). Data = mean ± SEM. Color coded as in B. ANOVA with Sidak's multiple comparisons test was used. ns, p > .05; *, p < .05; **, p < .01; ***, p < .001. F, Concentration-response for ΔV50 (hKV7.2/7.3 expressed in Xenopus oocytes) at pH 7.4 for Wu109, Wu199, and Wu200 as indicated. Data = mean ± SEM. Equation 3 for Wu199: ΔVMAX = −31.9 ± 1.8 mV, EC50 = 12.3 ± 2.2 µM, (n = 3–8). Equation 3 for Wu200: ΔVMAX = −37.2 ± 1.2 mV, EC50 = 11.7 ± 1.3 µM, (n = 4–7). For Wu109, see D. (G) G(V) shifts (ΔV50) (hKV7.2/7.3 expressed in Xenopus oocytes) at pH 7.4 by 30 µM of indicated compound. Data = mean ± SEM. Resin acid derivatives are color coded as in B. Data for RTG from Figure 2C. Data for Wu161 from Figure 1E. Data for Wu109, Wu199, and Wu200 from E. Wu181: −34.1 ± 3.1 mV (n = 5). ANOVA with Dunnett's multiple comparison test was used for comparison with RTG (dashed line). ns, p > .05; **, p < .01; ***, p < .001; ****, p < .0001 |
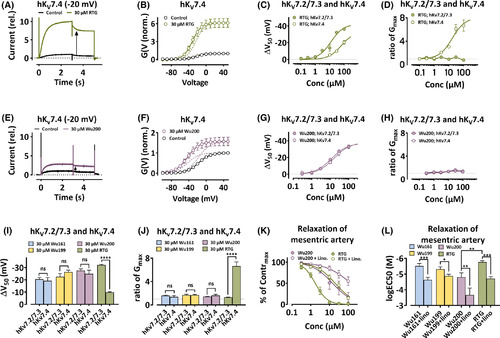
Retigabine (RTG) and resin acid derivatives open the KV7.4 channel and induce linopirdine-sensitive relaxation. A, Currents through hKV7.4 (expressed in Xenopus oocytes) in control and RTG as indicated. Holding voltage = −100 mV; voltage step 1 (3 s) = −20 mV; voltage step 2 (2 s) = −30 mV (tail currents). The instantaneous current at step 2 was increased by a factor of 10 (black arrow). B, G(V) curves for recordings as in A. Data = mean ± SEM. Equation 2: V50 = −21.1 ± 1.0 mV, −30.9 ± 1.2 mV, ΔV50 = −9.8 ± 0.5 mV; GMAX increased by a factor of 6.1 ± 0.2 (n = 7). Dashed line indicates the contribution from the GMAX increase and from the shift of G(V) respectively. C, Concentration-response for RTG on ΔV50 for hKV7.2/7.3 and hKV7.4 (both expressed in Xenopus oocytes) at pH 7.4. Data = mean ± SEM. Equation 3 for hKV7.2/7.3: ΔVMAX = −42.1 ± 2.4 mV, EC50 = 12.2 ± 2.2 µM (n = 3–5). Equation 3 for hKV7.4: ΔVMAX = −32.9 ± 5.7 mV, EC50 = 62.6 ± 22.1 µM (n = 6–7). D, Concentration response for RTG on ratio of GMAX for hKV7.2/7.3 and hKV7.4 (both expressed in Xenopus oocytes) as indicated at pH 7.4. Data = mean ± SEM. Equation 3 to hKV7.4: GMAX = 8.0 ± 0.8, EC50 = 17.0 ± 5.6 µM (n = 6–7). E, 30 µM Wu200 on hKV7.4 (B for explanation). The arrow indicated a 2.8-fold increase. F, G(V) curves for recordings as in E. Data = mean ± SEM. Equation 2: V50 = −17.3 ± 1.5 mV, −42.3 ± 3.3 mV, ΔV50 = −25.0 ± 2.9 mV; GMAX increased by a factor of 1.6 ± 0.1 (n = 7). Dashed lines separate the two effects. G, Wu200 on hKV7.2/7.3 (D for explanation). ΔVMAX = −37.2 ± 1.2 mV, EC50 = 11.7 ± 1.4 µM (n = 3–7). Wu200 on hKV7.4: ΔVMAX = −38.1 ± 2.6 mV, EC50 = 16.2 ± 3.4 µM (n = 4). H, Wu200 on hKV7.2/7.3 and hKV7.4 (E for explanation). I, G(V) shifts (ΔV50) for hKV7.2/7.3 and hKV7.4 (both expressed in Xenopus oocytes) at pH 7.4 as indicated. Data =mean ± SEM. Wu161 on hKV7.2/7.3: Data from Figure 1 F. Wu161 on hKV7.4: −19.2 ± 2.7 mV (n = 4). Wu199 on hKV7.2/7.3: Data from Figure 3E. Wu 199 on hKV7.4: −26.3 ± 1.6 mV (n = 3). Wu200 on hKV7.2/7.3: Data from Figure 3E. Wu 200 on hKV7.4: Data from H. RTG on hKV7.2/7.3: Data from Figure 2B. RTG on hKV7.4: Data from C. One-way ANOVA was used with Sidak's multiple comparison test. ns, p > .05; ****, p < .0001. J, Ratio of GMAX for hKV7.2/7.3 and hKV7.4 (both expressed in Xenopus oocytes) at pH 7.4 as indicated. Data = mean ± SEM. Wu161 on hKV7.2/7.3: 1.6 ± 0.1 (n = 8). Wu161 on hKV7.4: 1.4 ± 0.2 (n = 4). Wu199 on hKV7.2/7.3: 1.7 ± 0.2 (n = 6). Wu199 on hKV7.4: 1.7± 0.1 (n = 3). Wu200 on hKV7.2/7.3: 1.4 ± 0.1 (n = 4). Wu200 on hKV7.4: 1.6 ± 0.2 (n = 4). RTG on hKV7.2/7.3: 1.3 ± 0.1 (n = 5). RTG on hKV7.4: 6.6 ± 0.7 (n = 7). ANOVA with Sidak's multiple comparison test was used. ns, p > .05; ****, p < .0001. K, Concentration-response curves for the relaxation of mesenteric artery as indicated. Data measured as % of initial maximal concentration to methoxamine (% of Contrmax), circles = mean ± SEM, n = number of animals. Equation 3: RTG: EC50 = 1.74 ± 0.17 µM (n = 6); Wu200: EC50 = 14.6 ± 4.4 µM (n = 7). In presence of linopirdine (Lino., 10 µM): RTG+lino: EC50 = 20.0 ± 2.6 µM (n = 6); Wu200+lino: EC50 = 139.8 ± 56.1 µM (n = 7). L, Concentration dependence for relaxation of mesenteric arteries by indicated compounds. Data = mean ± SEM, n = number of animals. lg EC50 (M): Wu161: −5.51 ± 0.16, Wu161 + lino: −4.63 ± 0.16 (n = 7); Wu199: −5.31 ± 0.15, Wu199 + lino: −4.88 ± 0.11 (n = 7); Wu200: −4.80 ± 0.27, Wu200 + lino: −3.67 ± 0.44 (n = 7); RTG: −5.757 ± 0.096, RTG + lino: −4.71 ± 0.12 (n = 6); Paired t-test was used. *, p < .05; **, p < .01; ***, p < .001 |

Selectivity for compounds (as indicated) among other ion channels expressed in cell lines HEK-NaV1.5, CHO-hERG DUO, and CHO-CaV1.2, using automated patch clamp. A, Voltage step protocol for hNaV1.5. B, Currents for hNaV1.5 in control or Wu161 as indicated. Holding voltage (VH) = −120 mV. Test step voltage = −20 mV. C, Holding voltage = −60 mV. Test step voltage = −10 mV. D, G(V) curves as indicated. Activation curve; test step voltage indicated on x-axis. Inactivation curve; holding voltage indicated on x-axis. Data = mean ± SEM (n = 4). Equation 2: V50 (activation) = −30.1 ± 1.5 mV, −33.5 ± 2.7 mV; V50 (inactivation) = −53.8 ± 1.1 mV, −65.5 ± 1.2 mV. E, Concentration response for G(V) shifts (ΔV50) as indicated. Data = mean ± SEM (n = 3–10). Data are baseline corrected (i.e., saline). Two-way ANOVA with Dunnett's multiple comparisons test showed no significant deviation from saline. F, Concentration response for steady-state inactivation shifts as indicated (see E for explanation). *, p < .05; **, p < .01; ****, p < .0001. G, Voltage step protocol for hERG. H, Concentration response for G(V) shifts as indicated (see E for explanation). (n = 4–6). **, p < .01; ****, p < .0001. I, Concentration response for the ratio of IMAX as indicated (see E for explanation). (n = 4–6). *, p < .05; ****, p < .0001. J, Voltage step protocol for hCaV1.2. K, Concentration response for the shift of the G(V) as indicated (see E for explanation. (n = 4–12). **, p < .01. L, Concentration response for the steady-state inactivation shifts as indicated (see E for explanation). (n = 4–12). ***, p < .001; ****, p < .0001 |
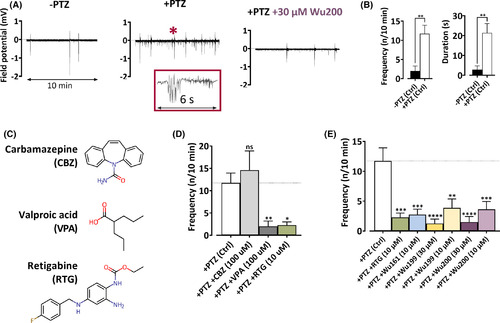
Wu-compounds reduce epileptic seizures in zebrafish larvae. A, Field potential recordings during 10 min in control solution (left), after induction of epileptic activity by 15 mM pentylenetetrazol (PTZ, middle), and after application of 30 µM Wu200 (right). The inset in the middle figure shows a typical epileptic activity, expanded from the activity marked by the asterisk in main figure. B, PTZ induces epileptic activity. Data = mean ± SEM. Left: the frequency of epileptic activity (during 10 min) in control solution: 2.0 ± 1.3 (n = 6), and in presence of PTZ: 11.7 ± 2.2 (n = 11). Right: the total duration of epileptic activity (during 10 min) in control solution: 2.8 ± 1.8 s (n = 8), and in presence of PTZ 21.4 ± 4.7 s (n = 18). For comparisons, two-tailed unpaired t-test was used. **, p < .01. C, Molecular structure for antiseizure drugs used for method validation. D, See B for explanation. Without drug (+PTZ [Ctrl]): 11.7 ± 2.2 (n = 11); CBZ (100 µM): 14.6 ± 4.3 (n = 5); VPA (100 µM): 2.0 ± 1.2 (n = 7); RTG (10 µM): 2.3 ± 0.7 (n = 7). One-way ANOVA was used with Dunnett's multiple comparison test to compare to + PTX (Ctrl). ns, p > .05; *, p < .05; **, p < .01. E, See B for explanation. +PTZ (Ctrl): see data in D; RTG (10 µM): see data in D, Wu161 (10 µM): 2.7 ± 0.9 (n = 8); Wu199 (30 µM): 1.2 ± 0.7 (n = 8); Wu199 (10 µM): 3.9 ± 1.5 (n = 8); Wu200 (30 µM): 1.5 ± 0.9 (n = 8); Wu200 (10 µM): 3.6 ± 1.3 (n = 8). One-way ANOVA was used with Dunnett's multiple comparison test to compare to +PTX (Ctrl). **, p < .01; ***, p < .001; ****, p < .0001 |