
Fig. 4
- ID
- ZDB-IMAGE-220217-6
- Publication
- Ottosson et al., 2021 - Synthetic resin acid derivatives selectively open the hKV 7.2/7.3 channel and prevent epileptic seizures
- All Figures
- Figures for Ottosson et al., 2021
|
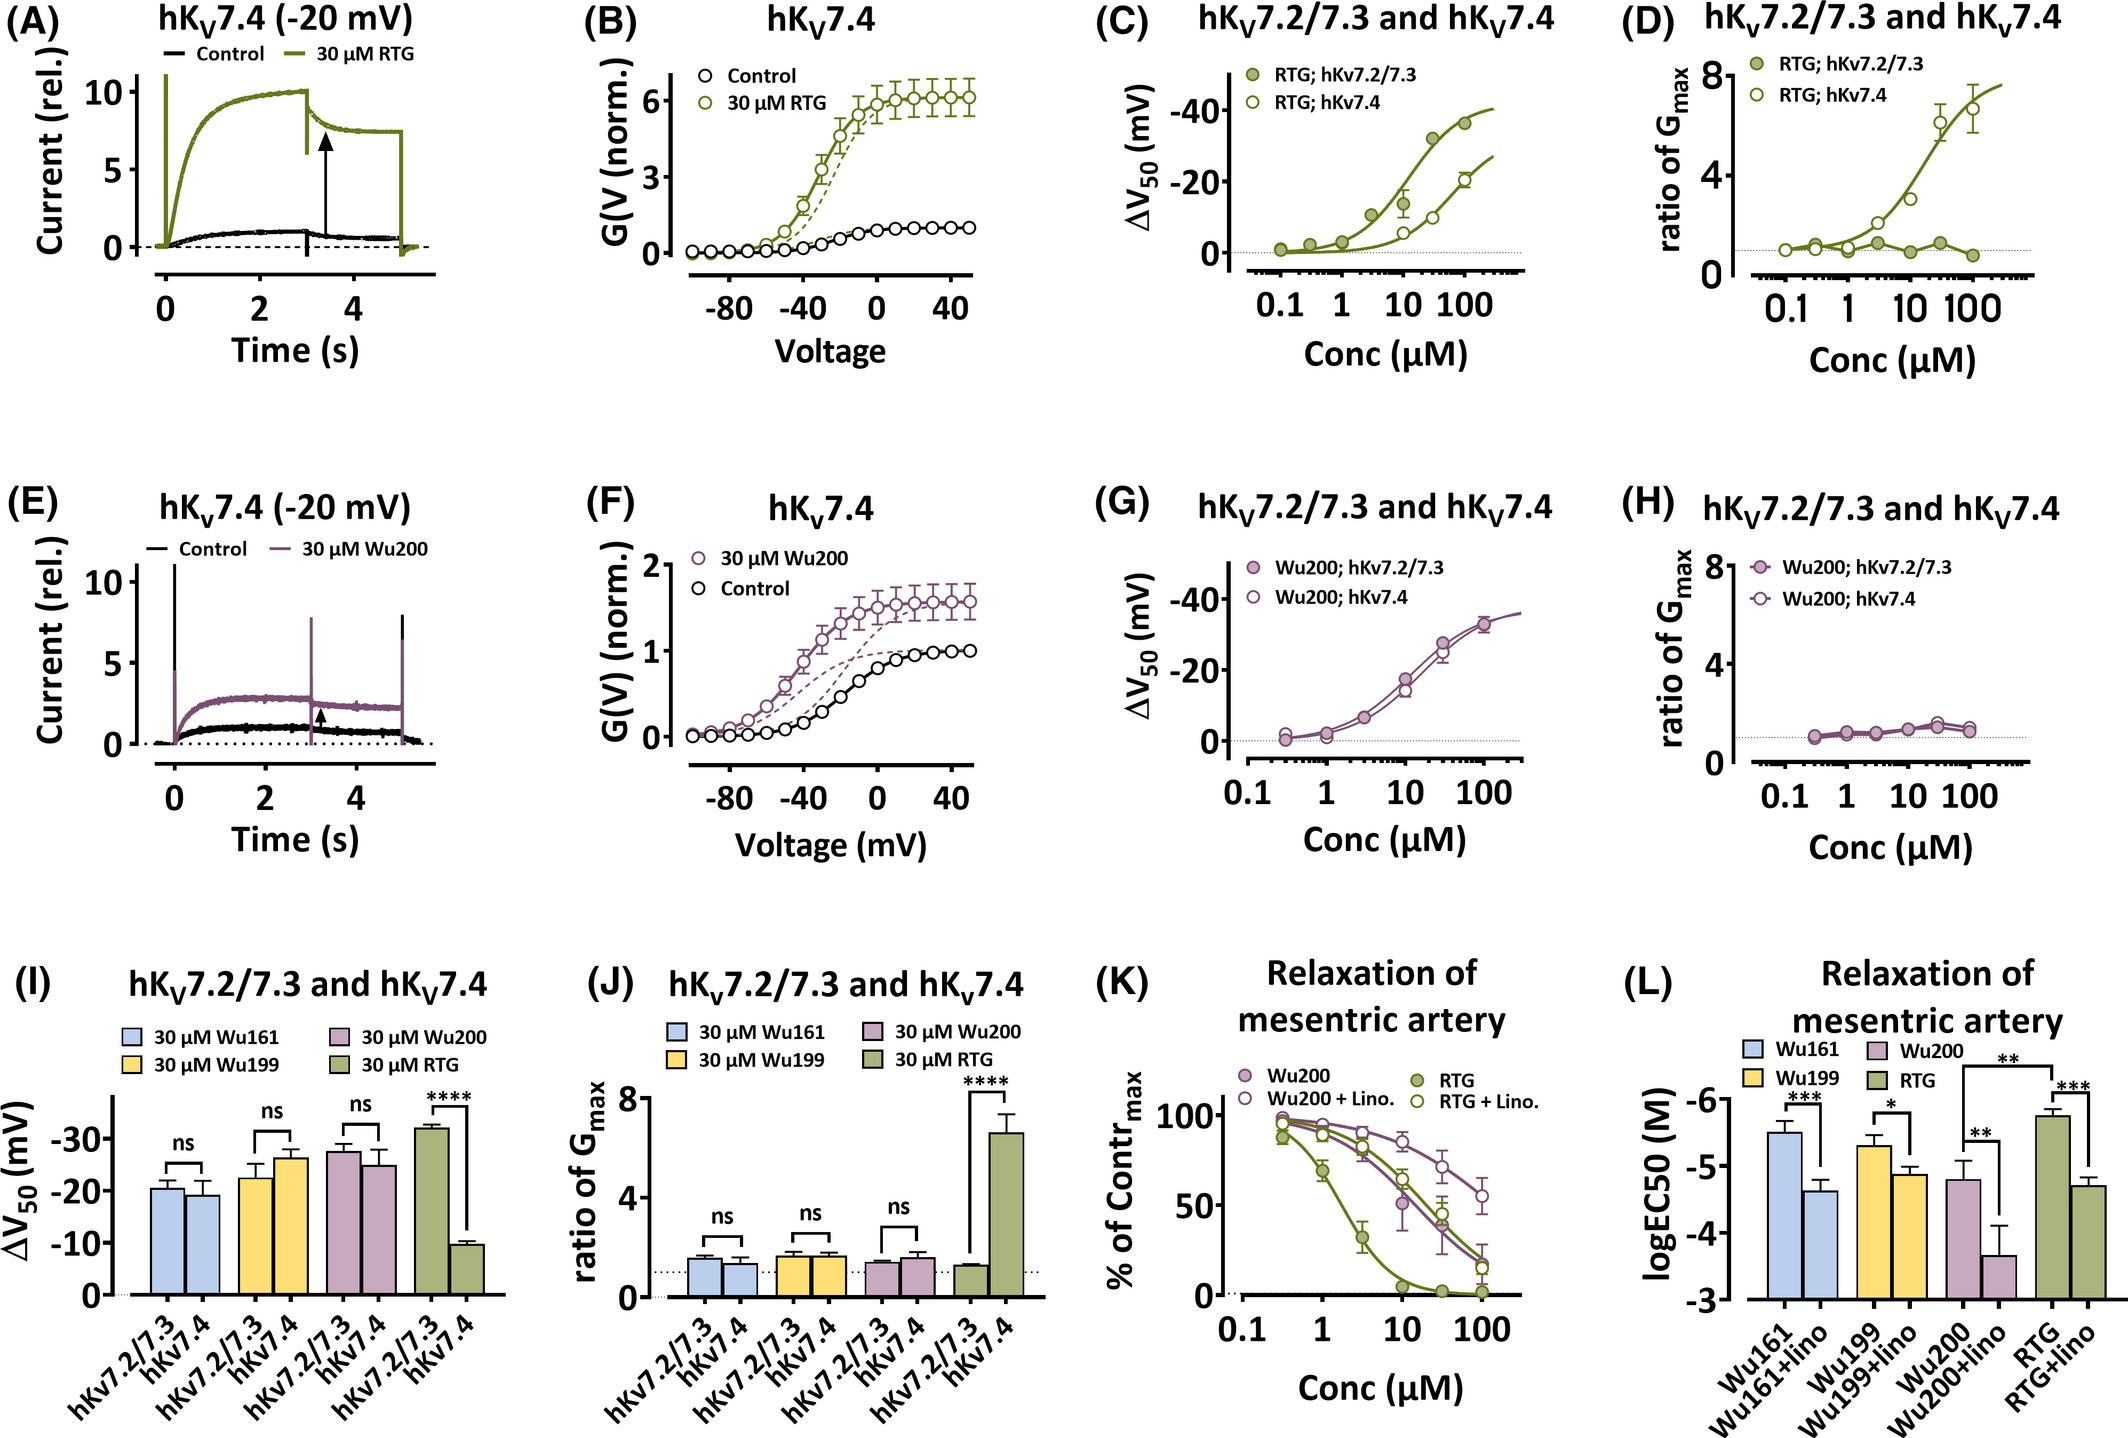
Fig. 4 Retigabine (RTG) and resin acid derivatives open the KV7.4 channel and induce linopirdine-sensitive relaxation. A, Currents through hKV7.4 (expressed in Xenopus oocytes) in control and RTG as indicated. Holding voltage = −100 mV; voltage step 1 (3 s) = −20 mV; voltage step 2 (2 s) = −30 mV (tail currents). The instantaneous current at step 2 was increased by a factor of 10 (black arrow). B, G(V) curves for recordings as in A. Data = mean ± SEM. Equation 2: V50 = −21.1 ± 1.0 mV, −30.9 ± 1.2 mV, ΔV50 = −9.8 ± 0.5 mV; GMAX increased by a factor of 6.1 ± 0.2 (n = 7). Dashed line indicates the contribution from the GMAX increase and from the shift of G(V) respectively. C, Concentration-response for RTG on ΔV50 for hKV7.2/7.3 and hKV7.4 (both expressed in Xenopus oocytes) at pH 7.4. Data = mean ± SEM. Equation 3 for hKV7.2/7.3: ΔVMAX = −42.1 ± 2.4 mV, EC50 = 12.2 ± 2.2 µM (n = 3–5). Equation 3 for hKV7.4: ΔVMAX = −32.9 ± 5.7 mV, EC50 = 62.6 ± 22.1 µM (n = 6–7). D, Concentration response for RTG on ratio of GMAX for hKV7.2/7.3 and hKV7.4 (both expressed in Xenopus oocytes) as indicated at pH 7.4. Data = mean ± SEM. Equation 3 to hKV7.4: GMAX = 8.0 ± 0.8, EC50 = 17.0 ± 5.6 µM (n = 6–7). E, 30 µM Wu200 on hKV7.4 (B for explanation). The arrow indicated a 2.8-fold increase. F, G(V) curves for recordings as in E. Data = mean ± SEM. Equation 2: V50 = −17.3 ± 1.5 mV, −42.3 ± 3.3 mV, ΔV50 = −25.0 ± 2.9 mV; GMAX increased by a factor of 1.6 ± 0.1 (n = 7). Dashed lines separate the two effects. G, Wu200 on hKV7.2/7.3 (D for explanation). ΔVMAX = −37.2 ± 1.2 mV, EC50 = 11.7 ± 1.4 µM (n = 3–7). Wu200 on hKV7.4: ΔVMAX = −38.1 ± 2.6 mV, EC50 = 16.2 ± 3.4 µM (n = 4). H, Wu200 on hKV7.2/7.3 and hKV7.4 (E for explanation). I, G(V) shifts (ΔV50) for hKV7.2/7.3 and hKV7.4 (both expressed in Xenopus oocytes) at pH 7.4 as indicated. Data =mean ± SEM. Wu161 on hKV7.2/7.3: Data from Figure 1 F. Wu161 on hKV7.4: −19.2 ± 2.7 mV (n = 4). Wu199 on hKV7.2/7.3: Data from Figure 3E. Wu 199 on hKV7.4: −26.3 ± 1.6 mV (n = 3). Wu200 on hKV7.2/7.3: Data from Figure 3E. Wu 200 on hKV7.4: Data from H. RTG on hKV7.2/7.3: Data from Figure 2B. RTG on hKV7.4: Data from C. One-way ANOVA was used with Sidak's multiple comparison test. ns, p > .05; ****, p < .0001. J, Ratio of GMAX for hKV7.2/7.3 and hKV7.4 (both expressed in Xenopus oocytes) at pH 7.4 as indicated. Data = mean ± SEM. Wu161 on hKV7.2/7.3: 1.6 ± 0.1 (n = 8). Wu161 on hKV7.4: 1.4 ± 0.2 (n = 4). Wu199 on hKV7.2/7.3: 1.7 ± 0.2 (n = 6). Wu199 on hKV7.4: 1.7± 0.1 (n = 3). Wu200 on hKV7.2/7.3: 1.4 ± 0.1 (n = 4). Wu200 on hKV7.4: 1.6 ± 0.2 (n = 4). RTG on hKV7.2/7.3: 1.3 ± 0.1 (n = 5). RTG on hKV7.4: 6.6 ± 0.7 (n = 7). ANOVA with Sidak's multiple comparison test was used. ns, p > .05; ****, p < .0001. K, Concentration-response curves for the relaxation of mesenteric artery as indicated. Data measured as % of initial maximal concentration to methoxamine (% of Contrmax), circles = mean ± SEM, n = number of animals. Equation 3: RTG: EC50 = 1.74 ± 0.17 µM (n = 6); Wu200: EC50 = 14.6 ± 4.4 µM (n = 7). In presence of linopirdine (Lino., 10 µM): RTG+lino: EC50 = 20.0 ± 2.6 µM (n = 6); Wu200+lino: EC50 = 139.8 ± 56.1 µM (n = 7). L, Concentration dependence for relaxation of mesenteric arteries by indicated compounds. Data = mean ± SEM, n = number of animals. lg EC50 (M): Wu161: −5.51 ± 0.16, Wu161 + lino: −4.63 ± 0.16 (n = 7); Wu199: −5.31 ± 0.15, Wu199 + lino: −4.88 ± 0.11 (n = 7); Wu200: −4.80 ± 0.27, Wu200 + lino: −3.67 ± 0.44 (n = 7); RTG: −5.757 ± 0.096, RTG + lino: −4.71 ± 0.12 (n = 6); Paired t-test was used. *, p < .05; **, p < .01; ***, p < .001