
Fig. 1
- ID
- ZDB-IMAGE-220217-3
- Publication
- Ottosson et al., 2021 - Synthetic resin acid derivatives selectively open the hKV 7.2/7.3 channel and prevent epileptic seizures
- All Figures
- Figures for Ottosson et al., 2021
|
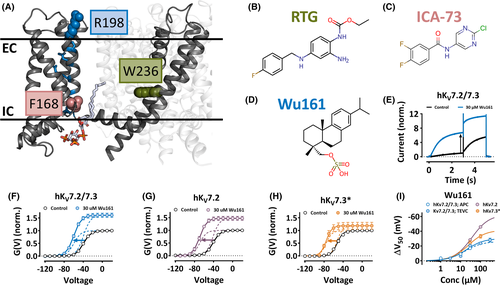
Fig. 1 Wu161 opens homo- and heterotetramers of hKV7.2 and hKV7.3. A, Side view of an hKV7.2 channel subunit (based on Protein Data Bank 6V01) in the presence of phosphatidylinositol 4,5-biphosphate (PIP2). EC, extracellular side; IC, intracellular side. Blue sticks, gating charges of S4 (R2–R6); blue spheres, gating charge of S4 highlighted in this study (R1 = R198); pink spheres, residue important for the effects of ICA-73 (F168); green spheres, residue important for the effect of RTG (W236). B, Molecular structure of retigabine (RTG). C, Molecular structure of ICA-069673 (ICA-73). D, Molecular structure of Wu161. E, Current traces for hKV7.2/7.3 in control solution and Wu161 as indicated; voltage step 1 = −50 mV; voltage step 2 = −30 mV (tail currents). End of step 1 (as well as instantaneous current at step 2) was increased by a factor of 6.0 (black arrow). F-H, G(V) curves for hKV7.2/7.3 (F), hKV7.2 (G), and hKV7.3* (=hKV7.3[A315T]; H) in control solution or Wu161 as indicated. Data = mean ± SEM. Thick lines (best fit of Equation 2). Dashed lines are decomposed compound effects with respect to isolated ΔV and GMAX effects. Wu161 (30 µM) altered V50. hKV7.2/7.3: V50 = −39.0 ± 1.0 mV, −59.6 ± 0.6 mV, ΔV50 = −20.6 ± 1.4 mV (n = 8). hKV7.2: V50 = −41.1 ± 0.6 mV, −69.4 ± 1.6 mV, ΔV50 = −28.3 ± 1.8 mV (n = 4). hKV7.3* = −52.2 ± 1.5 mV, −76.4 ± 2.7 mV, ΔV50 = −24.2 ± 3.1 mV (n = 5). Wu161 (30 µM) increased GMAX. hKV7.2/7.3: GMAX = 1.6 ± 0.1 (n = 8). hKV7.2: GMAX = 1.6 ± 0.2 (n = 4). hKV7.3*: GMAX = 1.2 ± 0.1 (n = 5). One-way ANOVA was used with Tukey's multiple comparison test and there were no significant differences between the channels for either ΔV50 or ratio of GMAX. I, Concentration-dependence for the effect of Wu161 on ΔV50 for hKV7.2/7.3 (expressed in oocytes [two-electrode voltage clamp, TEVC] and HEK cell line [automated patch clamp, APC]), and hKV7.2 and hKV7.3* (expressed in oocytes) as indicated. Data = mean ± SEM. Equation 3 was fitted to data. hKV7.2/7.3 (oocytes/TEVC): ΔVMAX = −30.3 ± 2.0 mV, EC50 = 19.9 ± 4.3 µM. hKV7.2/7.3 (HEK cells/APC): ΔVMAX = −26.2 ± 6.9 mV, EC50 = 16.8 ± 9.9 µM. hKV7.2: ΔVMAX = −62.9 ± 5.5 mV, EC50 = 36.7 ± 8.7 µM; hKV7.3*: ΔVMAX = −41.8 ± 4.5 mV, EC50 = 24.1 ± 6.8 µM (n = 4–8)