
|
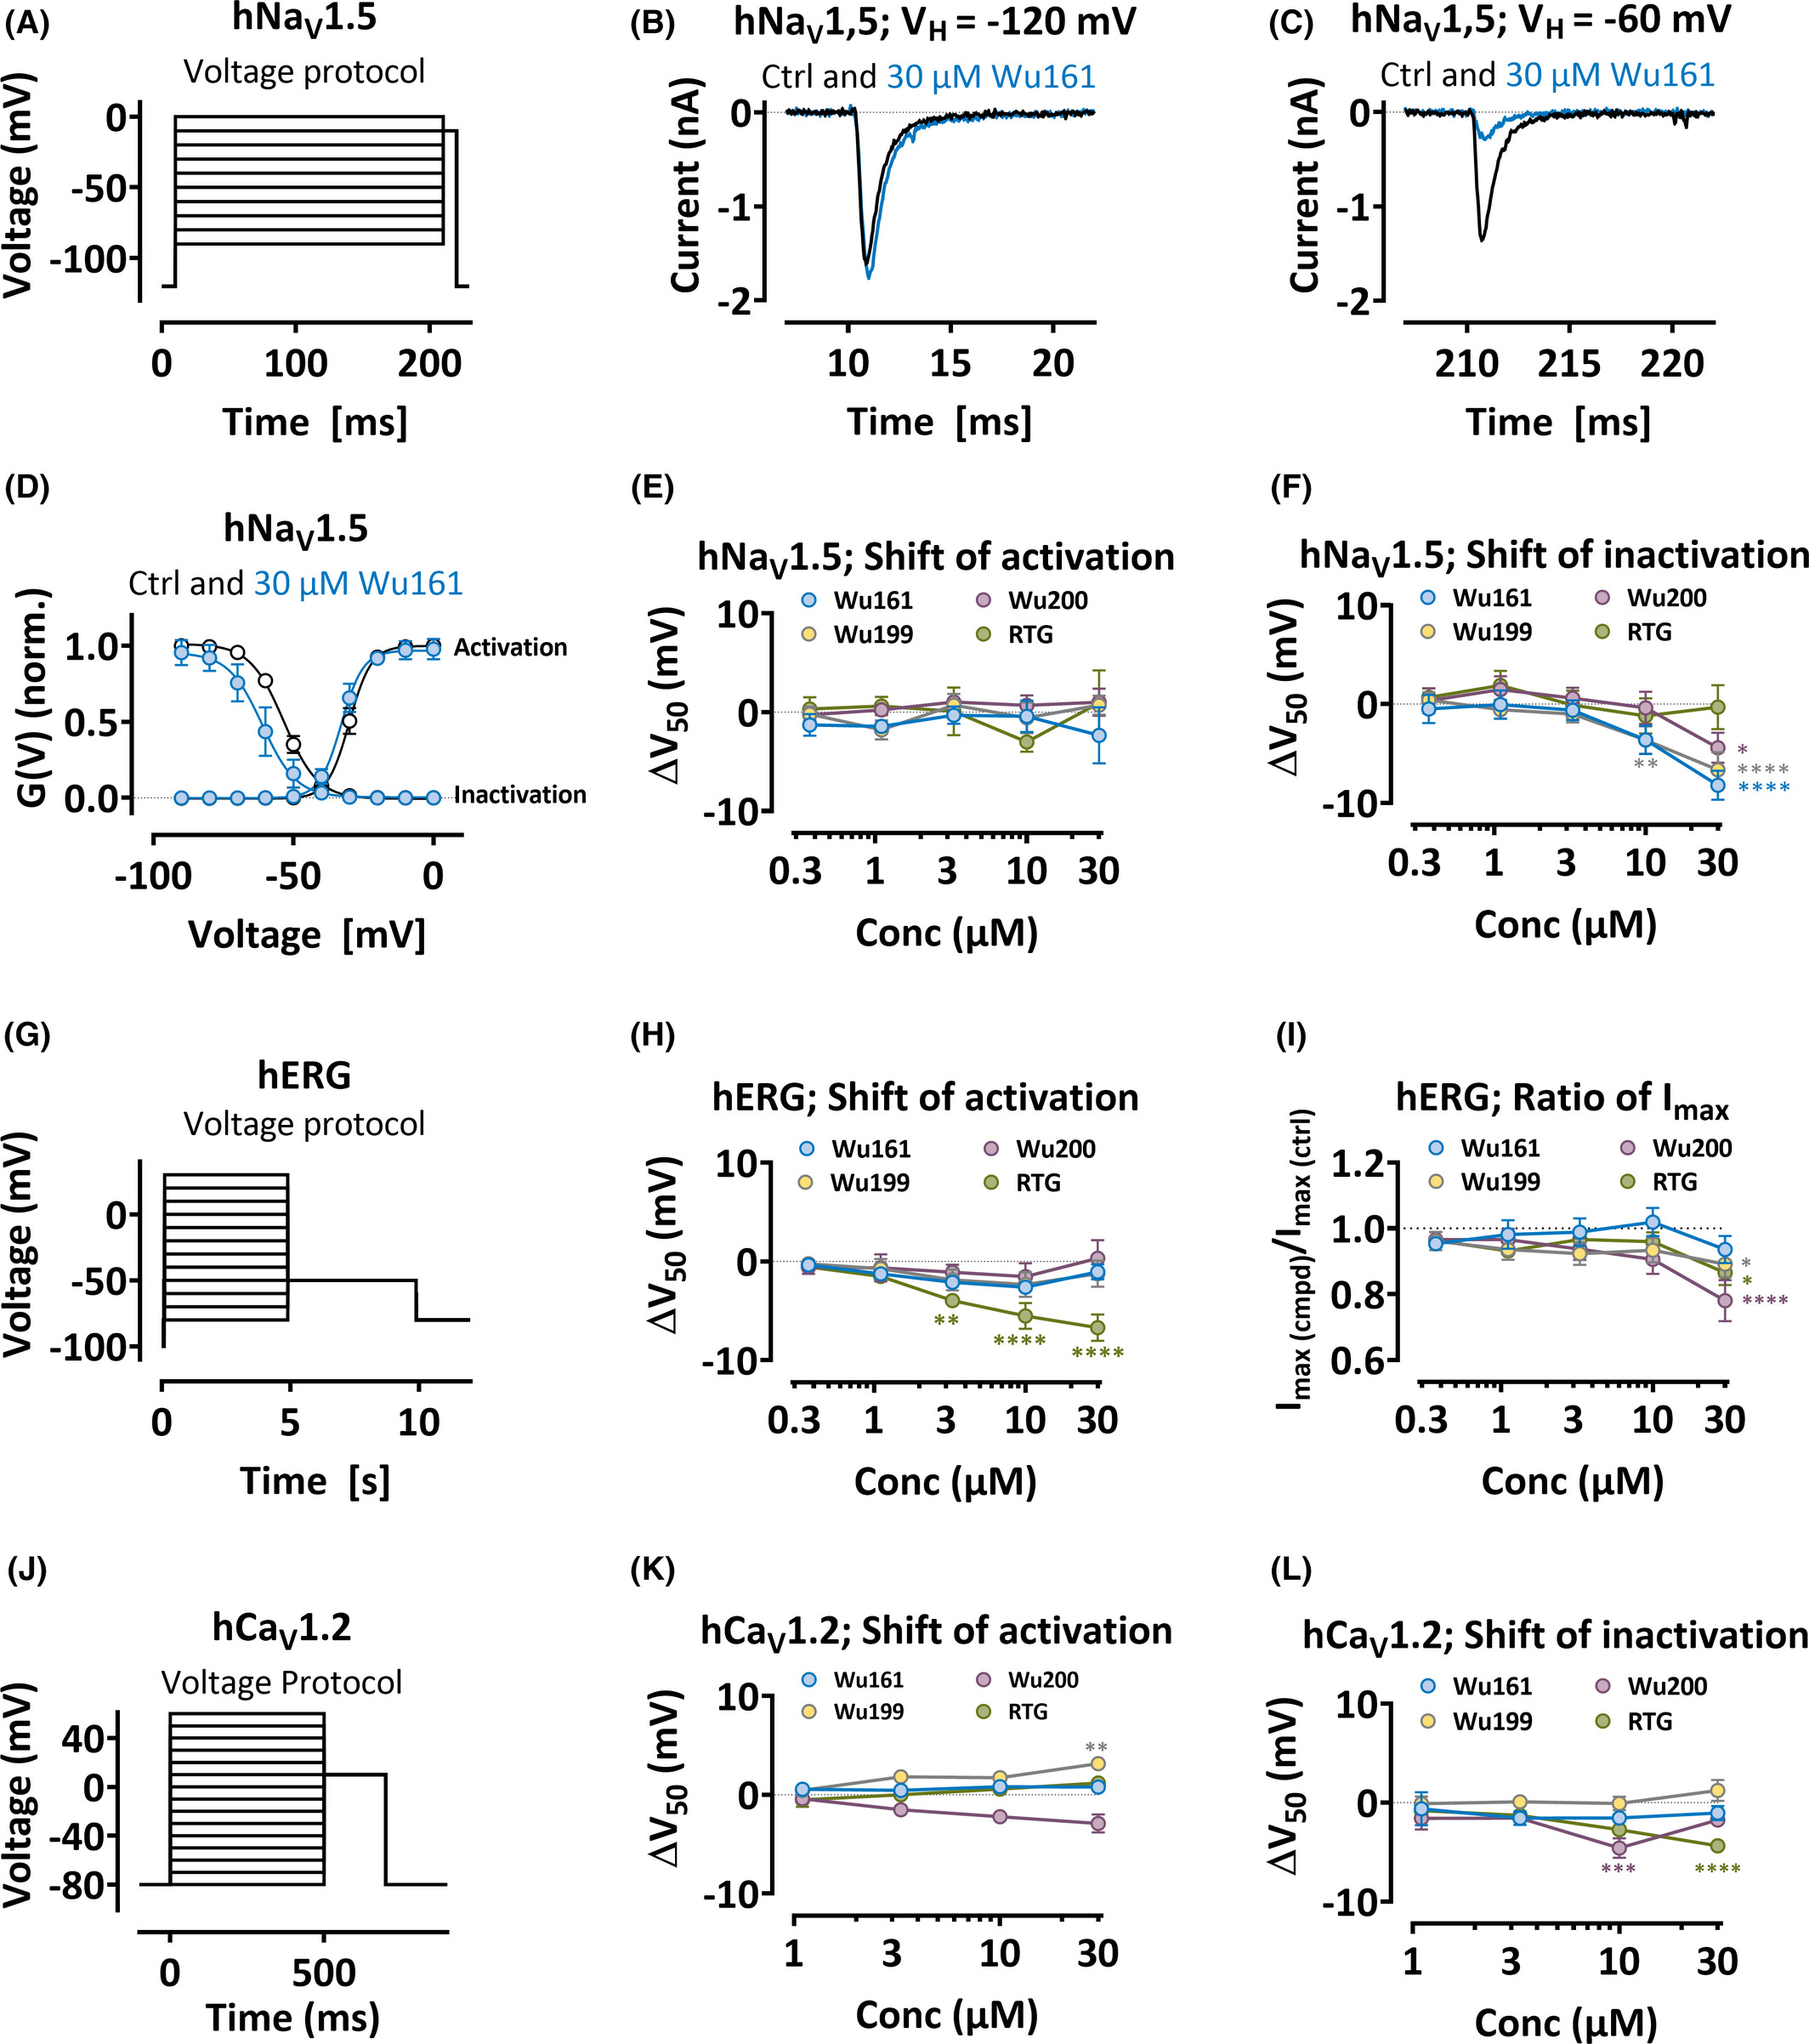
Fig. 5 Selectivity for compounds (as indicated) among other ion channels expressed in cell lines HEK-NaV1.5, CHO-hERG DUO, and CHO-CaV1.2, using automated patch clamp. A, Voltage step protocol for hNaV1.5. B, Currents for hNaV1.5 in control or Wu161 as indicated. Holding voltage (VH) = −120 mV. Test step voltage = −20 mV. C, Holding voltage = −60 mV. Test step voltage = −10 mV. D, G(V) curves as indicated. Activation curve; test step voltage indicated on x-axis. Inactivation curve; holding voltage indicated on x-axis. Data = mean ± SEM (n = 4). Equation 2: V50 (activation) = −30.1 ± 1.5 mV, −33.5 ± 2.7 mV; V50 (inactivation) = −53.8 ± 1.1 mV, −65.5 ± 1.2 mV. E, Concentration response for G(V) shifts (ΔV50) as indicated. Data = mean ± SEM (n = 3–10). Data are baseline corrected (i.e., saline). Two-way ANOVA with Dunnett's multiple comparisons test showed no significant deviation from saline. F, Concentration response for steady-state inactivation shifts as indicated (see E for explanation). *, p < .05; **, p < .01; ****, p < .0001. G, Voltage step protocol for hERG. H, Concentration response for G(V) shifts as indicated (see E for explanation). (n = 4–6). **, p < .01; ****, p < .0001. I, Concentration response for the ratio of IMAX as indicated (see E for explanation). (n = 4–6). *, p < .05; ****, p < .0001. J, Voltage step protocol for hCaV1.2. K, Concentration response for the shift of the G(V) as indicated (see E for explanation. (n = 4–12). **, p < .01. L, Concentration response for the steady-state inactivation shifts as indicated (see E for explanation). (n = 4–12). ***, p < .001; ****, p < .0001