
Fig. 3
- ID
- ZDB-FIG-220217-9
- Publication
- Ottosson et al., 2021 - Synthetic resin acid derivatives selectively open the hKV 7.2/7.3 channel and prevent epileptic seizures
- Other Figures
- All Figure Page
- Back to All Figure Page
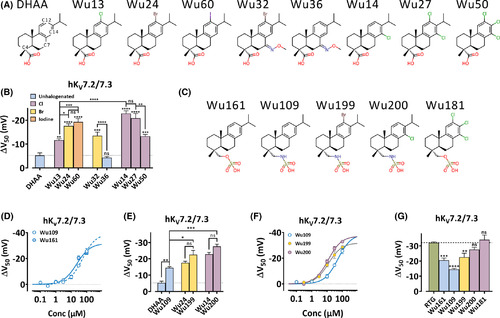
Structural modifications of the resin acid derivatives affects channel activation. A, Molecular structures of dehydroabietic acid (DHAA, including numbering of some carbon atoms) and investigated resin acid derivatives with a carboxyl group. B, G(V) shifts (ΔV50) (hKV7.2/7.3 expressed in Xenopus oocytes) at pH 9 by 30 µM of indicated compound. Data = mean ± SEM. Color coding according to halogenation as indicated. G(V) shifts: DHAA: −5.3 ± 1.1 mV (n = 5); Wu13: −11.6 ± 0.6 mV (n = 6); Wu24: −17.6 ± 0.9 mV (n = 4); Wu60: −19.3 ± 1.4 mV (n = 6); Wu32: −13.6 ± 1.5 mV (n = 4); Wu36: −4.3 ± 0.5 mV (n = 5); Wu14: −22.9 ± 1.1 mV (n = 4); Wu27: −20.9 ± 2.0 mV (n = 5); Wu50: −13.3 ± 0.8 mV (n = 4). One-way ANOVA was used with Sidak's multiple comparison test. For comparison with DHAA (dotted line), the significance is given above each bar. ns, p > .05; *, p < .05; **, p < .01; ***, p < .001; ****, p < .0001. C, Molecular structures of investigated resin acid derivatives with a sulfonyl group. D, Concentration-response for ΔV50 (hKV7.2/7.3 expressed in Xenopus oocytes) at pH 7.4 for Wu109 and Wu161 as indicated. Data = mean ± SEM. Equation 3 for Wu109: ΔVMAX = −38.8 ± 4.5 mV, EC50 = 51.1 ± 12.6 µM, (n = 3–4). Equation 3 for Wu161: ΔVMAX = −31.7 ± 3.0 mV, EC50 = 22.7 ± 5.8 µM, (n = 4–8). E, G(V) shifts (ΔV50) (hKV7.2/7.3 expressed in Xenopus oocytes) at pH 9.0 (30 µM DHAA, Wu24, and Wu14 [for data see B]) or at pH 7.4 (Wu109: −14.5 ± 0.7 mV (n = 6); Wu199: −22.6 ± 2.6 mV (n = 4); Wu200: −27.6 ± 1.4 mV (n = 4). Data = mean ± SEM. Color coded as in B. ANOVA with Sidak's multiple comparisons test was used. ns, p > .05; *, p < .05; **, p < .01; ***, p < .001. F, Concentration-response for ΔV50 (hKV7.2/7.3 expressed in Xenopus oocytes) at pH 7.4 for Wu109, Wu199, and Wu200 as indicated. Data = mean ± SEM. Equation 3 for Wu199: ΔVMAX = −31.9 ± 1.8 mV, EC50 = 12.3 ± 2.2 µM, (n = 3–8). Equation 3 for Wu200: ΔVMAX = −37.2 ± 1.2 mV, EC50 = 11.7 ± 1.3 µM, (n = 4–7). For Wu109, see D. (G) G(V) shifts (ΔV50) (hKV7.2/7.3 expressed in Xenopus oocytes) at pH 7.4 by 30 µM of indicated compound. Data = mean ± SEM. Resin acid derivatives are color coded as in B. Data for RTG from Figure 2C. Data for Wu161 from Figure 1E. Data for Wu109, Wu199, and Wu200 from E. Wu181: −34.1 ± 3.1 mV (n = 5). ANOVA with Dunnett's multiple comparison test was used for comparison with RTG (dashed line). ns, p > .05; **, p < .01; ***, p < .001; ****, p < .0001 |