
Fig. 6
- ID
- ZDB-IMAGE-220217-8
- Publication
- Ottosson et al., 2021 - Synthetic resin acid derivatives selectively open the hKV 7.2/7.3 channel and prevent epileptic seizures
- All Figures
- Figures for Ottosson et al., 2021
|
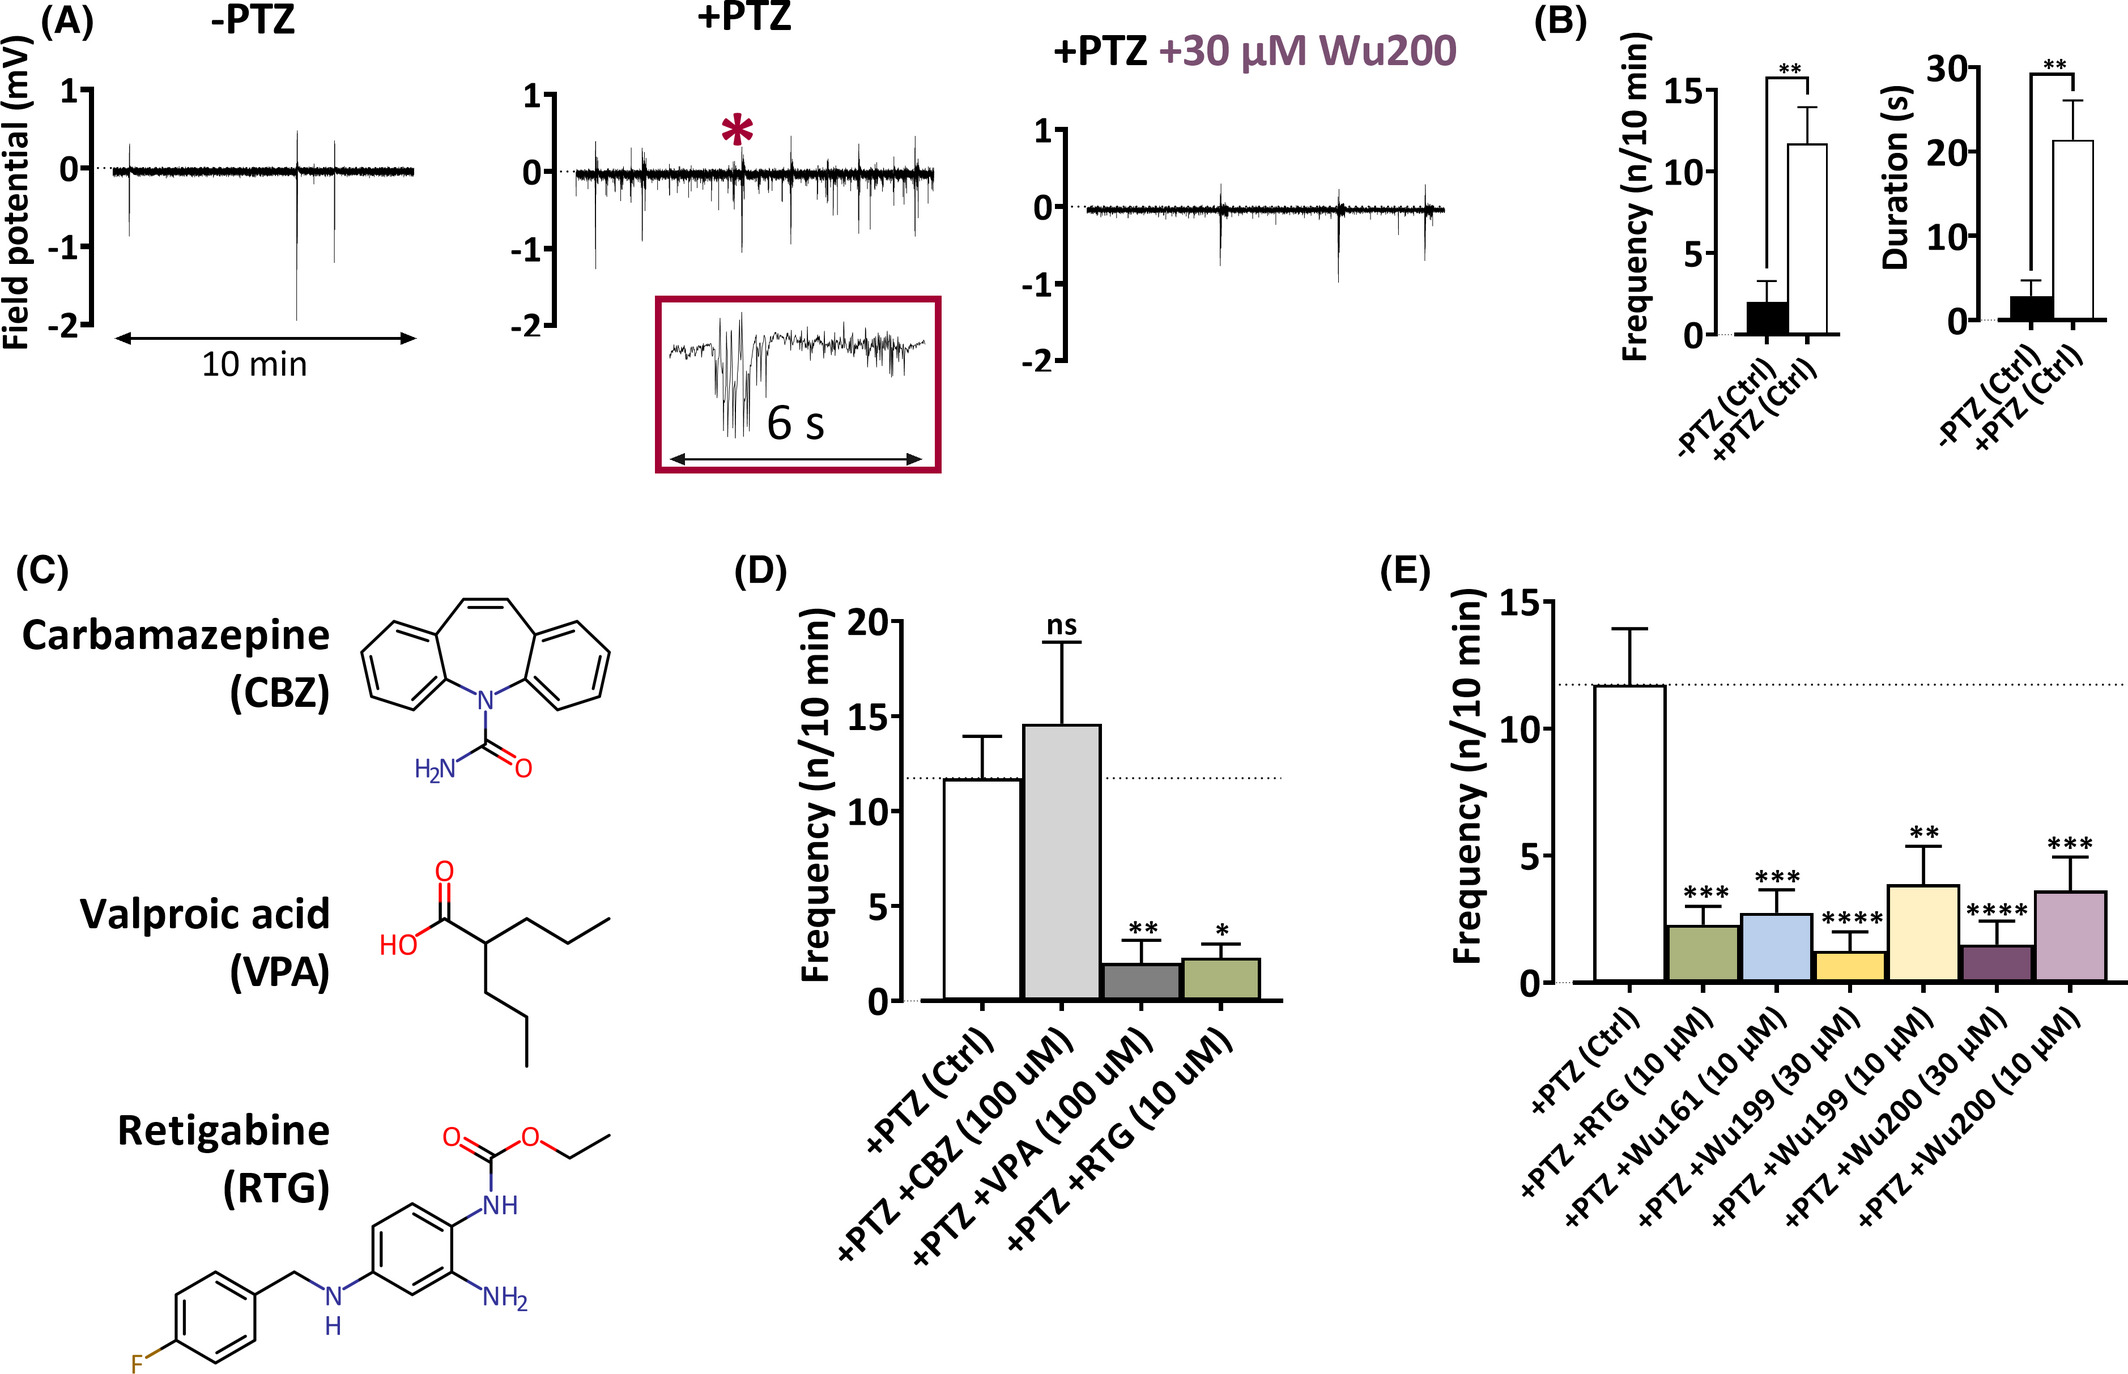
Fig. 6 Wu-compounds reduce epileptic seizures in zebrafish larvae. A, Field potential recordings during 10 min in control solution (left), after induction of epileptic activity by 15 mM pentylenetetrazol (PTZ, middle), and after application of 30 µM Wu200 (right). The inset in the middle figure shows a typical epileptic activity, expanded from the activity marked by the asterisk in main figure. B, PTZ induces epileptic activity. Data = mean ± SEM. Left: the frequency of epileptic activity (during 10 min) in control solution: 2.0 ± 1.3 (n = 6), and in presence of PTZ: 11.7 ± 2.2 (n = 11). Right: the total duration of epileptic activity (during 10 min) in control solution: 2.8 ± 1.8 s (n = 8), and in presence of PTZ 21.4 ± 4.7 s (n = 18). For comparisons, two-tailed unpaired t-test was used. **, p < .01. C, Molecular structure for antiseizure drugs used for method validation. D, See B for explanation. Without drug (+PTZ [Ctrl]): 11.7 ± 2.2 (n = 11); CBZ (100 µM): 14.6 ± 4.3 (n = 5); VPA (100 µM): 2.0 ± 1.2 (n = 7); RTG (10 µM): 2.3 ± 0.7 (n = 7). One-way ANOVA was used with Dunnett's multiple comparison test to compare to + PTX (Ctrl). ns, p > .05; *, p < .05; **, p < .01. E, See B for explanation. +PTZ (Ctrl): see data in D; RTG (10 µM): see data in D, Wu161 (10 µM): 2.7 ± 0.9 (n = 8); Wu199 (30 µM): 1.2 ± 0.7 (n = 8); Wu199 (10 µM): 3.9 ± 1.5 (n = 8); Wu200 (30 µM): 1.5 ± 0.9 (n = 8); Wu200 (10 µM): 3.6 ± 1.3 (n = 8). One-way ANOVA was used with Dunnett's multiple comparison test to compare to +PTX (Ctrl). **, p < .01; ***, p < .001; ****, p < .0001