
- Title
-
Transcriptome Analyses Reveal IL6/Stat3 Signaling Involvement in Radial Glia Proliferation After Stab Wound Injury in the Adult Zebrafish Optic Tectum
- Authors
- Shimizu, Y., Kiyooka, M., Ohshima, T.
- Source
- Full text @ Front Cell Dev Biol
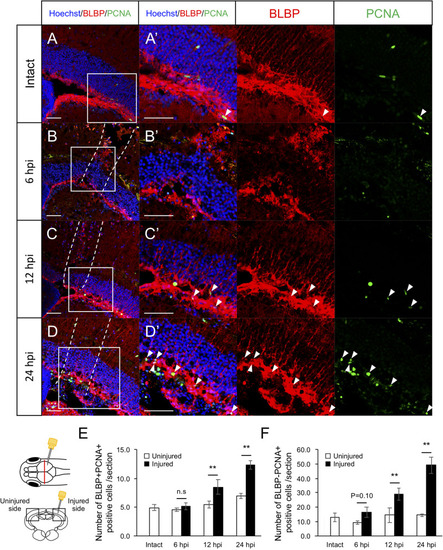
Induction of RG proliferation during the early stages after stab wound injury. |

Induction of IB4+ macrophage migration during the early stages after stab wound injury. |
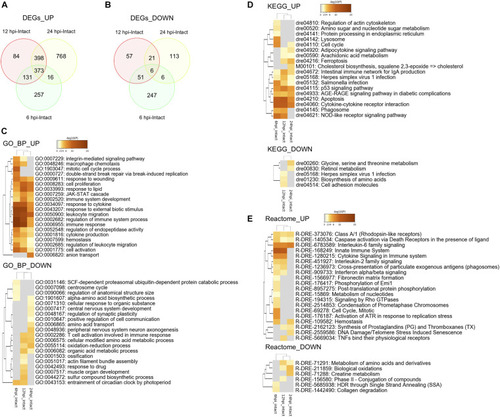
Transcriptomic and enrichment analyses during the early stages of optic tectum regeneration. |
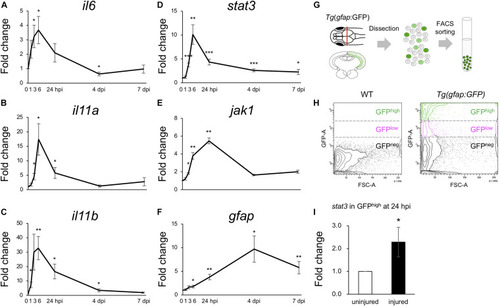
Activation of IL6/Stat3 signaling during the early stages of optic tectum regeneration. (A–F) Quantitative real-time (qRT-) PCR analyses of IL6 superfamily cytokines il6 (A), il11a (B), and il11b (C), and Jak/Stat signaling components stat3 (D), jak1 (E), and gfap (F). Each graph indicates relative gene expression in the injured tectum from 1 to 7 dpi compared to intact optic tectum (n = 4 per gene per time point). Statistical analyses between intact and injured hemispheres at each time point were evaluated using unpaired Student’s t-tests. (G) Schematic diagram of the cell sorting workflow using the RG-specific reporter line, Tg(gfap:GFP). (H) Representative images of FACS plots for GFP-positive cells from the optic tectum of wild-type (left) or Tg(gfap:GFP) (right) fish. (I) Quantification of stat3 expression in GFPhigh-positive cells from uninjured and injured optic tectum at 24 hpi using qPCR. The graph shows relative stat3 expression in GFPhigh-positive cells from injured tectum at 24 hpi compared to uninjured tectum (n = 11). Statistical analyses between uninjured and injured hemispheres was evaluated using unpaired Student’s t-tests. |
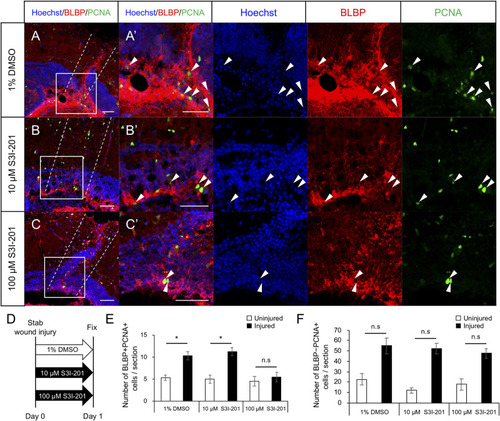
Stat3 inhibitor S3I-201 suppresses RG proliferation after stab wound injury in adult optic tectum. (A–C) Representative images of proliferative RG (BLBP+ PCNA+) in injured optic tectum treated with 1% DMSO (A), 10 μM S3I-201 (B), or 100 μM S3I-201 (C) at 1 dpi. (A’–C’) Magnified images of the boxed area in each image. White arrowheads indicate BLBP+ PCNA+ cells and dashed lines indicate the area injured by needle insertion. Scale bar: 50 μm in (A–C) and (A’–C’). (D) Schematic diagram of drug administration. (E) Quantification of proliferative RG (BLBP+ PCNA+) treated with 1% DMSO, 10 μM S3I-201 (n = 4), or 100 μM S3I-201 (n = 5) at 1 dpi. Statistical analyses were performed using one-way ANOVA with Tukey’s post hoc test. (F) Quantification of proliferative cells except RG (BLBP-PCNA+) treated with 1% DMSO, 10 μM S3I-201 (n = 4), or 100 μM S3I-201 (n = 5) at 1 dpi. Statistical analyses were performed using one-way ANOVA with Tukey’s post hoc test. |
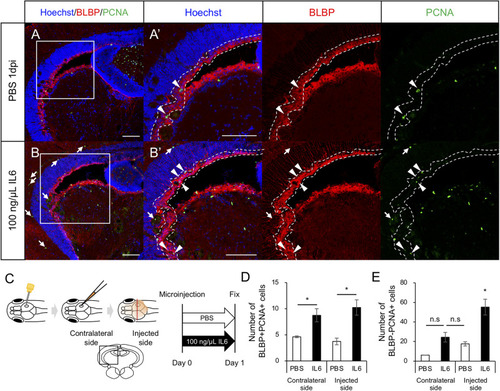
IL6 induces RG proliferation without stab wound injury in adult optic tectum. (A,B) Representative images of proliferative RG (BLBP+ PCNA+) in the contralateral side with PBS or 100 ng/μL IL6 at 1 dpi. Allow heads indicate BLBP+ PCNA+ cells and arrows indicate BLBP- PCNA+ cells. Scale bar: 100 μm in (A–D) and (A’,B’). (C) Schematic diagram of cerebroventricular microinjection. A small hole was made in the center of the skull above the right hemisphere of the optic tectum using a 30G needle. The injected solution spread through the corticospinal fluid. (D) Quantification of proliferative RG (BLBP+ PCNA+) in the injected and contralateral hemisphere with PBS (n = 4) or 100 ng/μL IL6 (n = 3) at 1 dpi. (E) Quantification of BLBP- PCNA+ cells in the injected and contralateral hemisphere with PBS or IL6 at 1 dpi. Statistical analyses were performed using one-way ANOVA with Tukey’s post hoc test. |