IMAGE

FIGURE 3

ID
ZDB-IMAGE-210520-48
Source
Figures for Shimizu et al., 2021
Image
Figure Caption

FIGURE 3

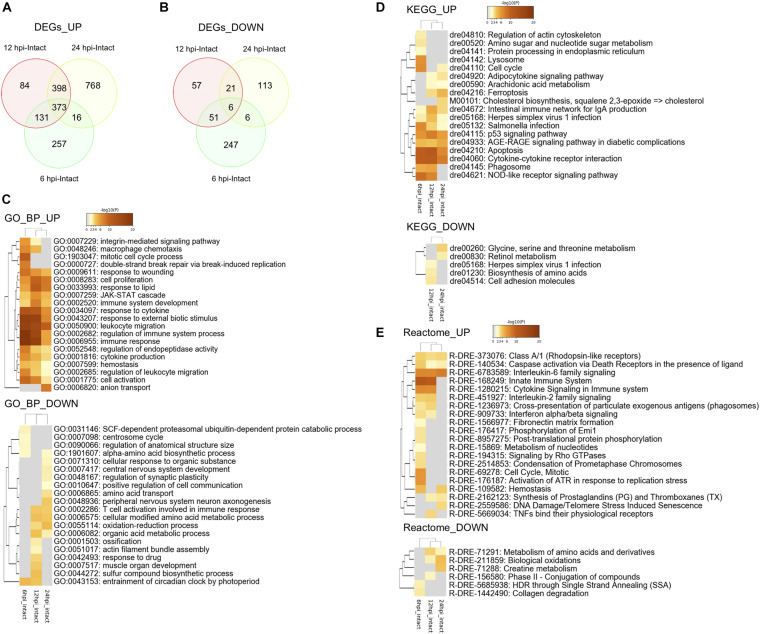
Transcriptomic and enrichment analyses during the early stages of optic tectum regeneration. (A,B) Venn diagram indicating upregulated (A) and downregulated (B) differentially expressed genes (DEGs) identified by DEseq2 between injured (6, 12, and 24 hpi) and intact optic tectum. Fold change >2 in both directions and FDR < 0.05. (C–E) Heatmaps indicating clusters of significantly enriched GO biological process (BP) (C), KEGG pathway (D), and Reactome pathway (E) terms based on DEGs between the injured and intact tectum (6, 12, and 24 hpi) using Metascape enrichment analysis. UP and DOWN indicate enrichment analyses based on up- and downregulated DEGs, respectively.

Acknowledgments
This image is the copyrighted work of the attributed author or publisher, and ZFIN has permission only to display this image to its users. Additional permissions should be obtained from the applicable author or publisher of the image. Full text @ Front Cell Dev Biol