
- Title
-
Identification of a Catalytic Active but Non-Aggregating MDM2 RING Domain Variant
- Authors
- Magnussen, H.M., Huang, D.T.
- Source
- Full text @ J. Mol. Biol.
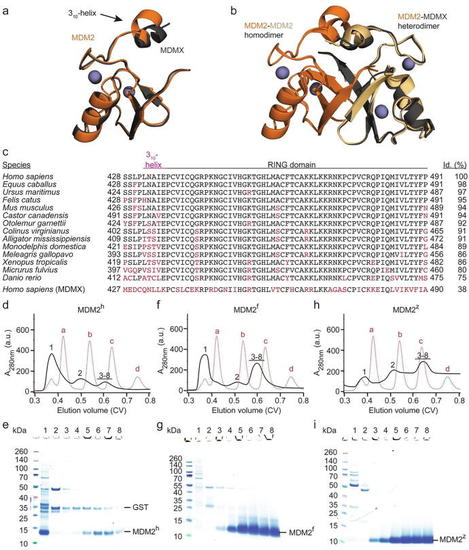
Aggregation of the MDM2 RING domain is species dependent. (a) Superimposition of human MDM2 428-C (orange) and MDMX 428-C (dark-gray) (PDB: 5MNJ). Zinc ions are shown as gray spheres. The 310-helix preceding the RING domain is indicated. (b) Superimposition of the MDM2 RING domain homodimer (PDB: 6SQO; the two monomeric MDM2 RING domains are colored in orange and light orange) and human MDM2-MDMX RING domain heterodimer (PDB: 5MNJ; MDM2 is orange and MDMX is dark-gray). Zinc ions are shown as gray spheres. (c) Sequence alignment of the C-terminal region of MDM2 from different species. The regions corresponding to the 310-helix in MDM2h and the RING domain are indicated. Sequence deviations from human MDM2 are highlighted in red. The sequence identity (id.) compared to human MDM2 is indicated on the right. (d, f, h) Superdex 75 elution profiles of MDM2h, MDM2f and MDM2z, respectively (shown in black solid line). The elution profile of molecular weight markers (a: bovine serum albumin, 66 kDa; b: carbonic anhydrase, 29 kDa; c: cytochrome C, 12.4 kDa; d: aprotinin, 6,5 kDa) is shown as red dashed line. After removal of GST-tag, the cleaved MDM2 variants (expressed from 24L LB) were applied on a HiLoad 16/600 Superdex 75 column. (e, g, i) SDS-PAGE of indicated fractions from panels d, f, h, respectively. The position of the fractions within the elution profile is indicated by numbers (1–8). |
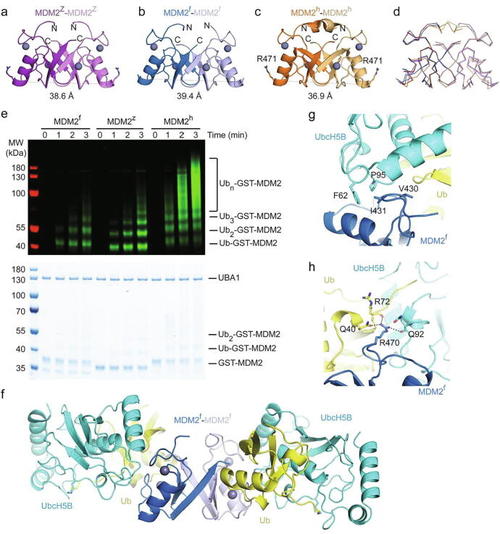
Structural characterization of MDM2f and MDM2z. (a–c) Crystal structures of MDM2z (a; purple/light purple), MDM2f (b; blue/light blue) and MDM2h (c; orange/light orange, PDB: 6SQO). Zinc ions are shown as gray spheres. The diameter of the dimer was calculated by measuring the distance between the Cα atoms of R471 (human nomenclature) of both protomers. (d) Superimposition of (a–c) in ribbon form. (e) Reduced SDS-PAGE showing autoubiquitination reactions catalyzed by GST-MDM2 variants using fluorescently-labeled Ub and visualized by an Odyssey CLx Imaging System (top panel) or stained with Coomassie Blue (bottom panel). (f) Crystal structure of the MDM2f-UbcH5B–Ub complex. UbcH5B and Ub are colored in cyan and yellow, respectively. MDM2f is colored as in b. (g,h) Close-up views of the key interactions between MDM2f and UbcH5B involving MDM2f’s I431 (g) and R470 (h), |
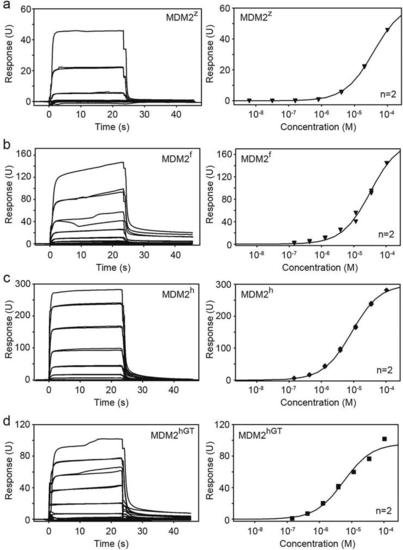
SPR analyses of GST-MDM2 variants and UbcH5B–Ub binding affinities. Representative sensorgrams (left) and binding curves (right) for (a) MDM2z and UbcH5B–Ub, (b) MDM2f and UbcH5B–Ub, (c) MDM2h and UbcH5B–Ub and (d) MDM2hGT and UbcH5B–Ub. n = 2 for each binding curve. |
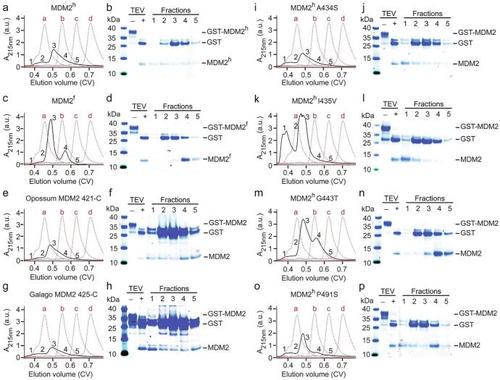
Systematic analysis of MDM2 RING domain aggregation across species (a, c, e, g, i, k, m, o) Superdex 75 elution profiles of MDM2h, MDM2f, opossum MDM2 421-C, galago MDM2 425-C, MDM2h A434S, MDM2h I435V, MDM2h G443T and MDM2h P491S, respectively (shown as black solid line). The elution profile of molecular weight markers (a: bovine serum albumin, 66 kDa; b: carbonic anhydrase, 29 kDa; c: cytochrome C, 12.4 kDa; d: aprotinin, 6,5 kDa) is shown as red dashed line. GST-MDM2 variants (expressed from 2L LB) were treated with TEV then loaded on a Superdex 75 Increase 10/300 column. (b, d, f, h, j, l, n, p) SDS-PAGE showing the GST-MDM2 variants before and after TEV treatment to release the GST-tag (labeled ‘–’ and ‘+’, respectively) and single fractions of the corresponding SEC experiments from panels a, c, e, g, i, k, m, o, respectively. The position of the fractions within the elution profile is indicated by numbers (1–5). |
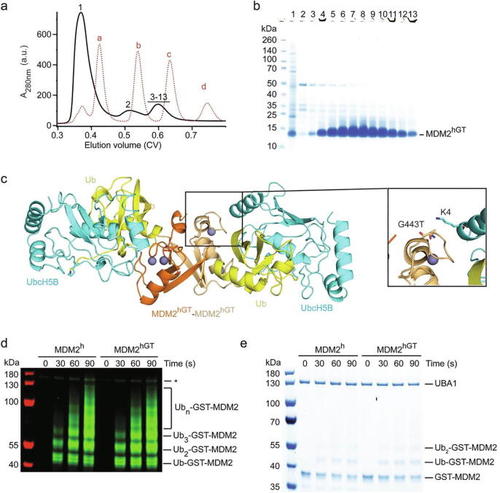
Functional and structural characterization of MDM2hGT. (a) Superdex 75 elution profile of MDM2hGT from a large-scale purification (shown as black solid line). The elution profile of molecular weight markers (a: bovine serum albumin, 66 kDa;b: carbonic anhydrase, 29 kDa; c: cytochrome C, 12.4 kDa; d: aprotinin, 6,5 kDa) is shown as red dashed line. (b) SDS-PAGE showing the purity of single fractions from a. The position of the fractions within the elution profile is indicated by numbers (1–13). The large absorbance in fraction 1 is due to the presence of other contaminants. (c) Crystal structure of the MDM2hGT-UbcH5B–Ub complex. The two MDM2hGT monomers are colored in orange and light orange. Zinc ions are shown as gray spheres. UbcH5B and Ub are colored in cyan and yellow, respectively. A representative close-up view of the local environment of G443T including the sidechain of UbcH5B’s K4 are shown. (d,e) Reduced SDS-PAGE showing autoubiquitination reactions catalyzed by GST-MDM2h and GST-MDM2hGT using fluorescently-labeled Ub and visualized by an Odyssey CLx Imaging System (d) or stained with Coomassie Blue (e). Asterisk in d indicates non-reducible E1–Ub product. |
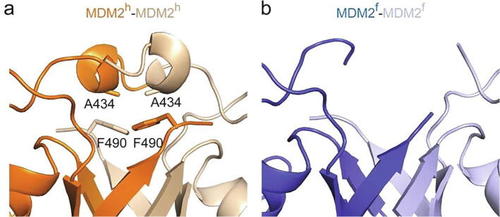
310-helix precedes the RING domain in MDM2. (a) Close-up view of the 310-helix that precedes the RING domain in MDM2h. Location of A434 within MDM2h is indicated. (b) Close-up view of the corresponding region in MDM2f. No electron density was observed in this region. |