
Image
|
Figure Caption
Figure 3
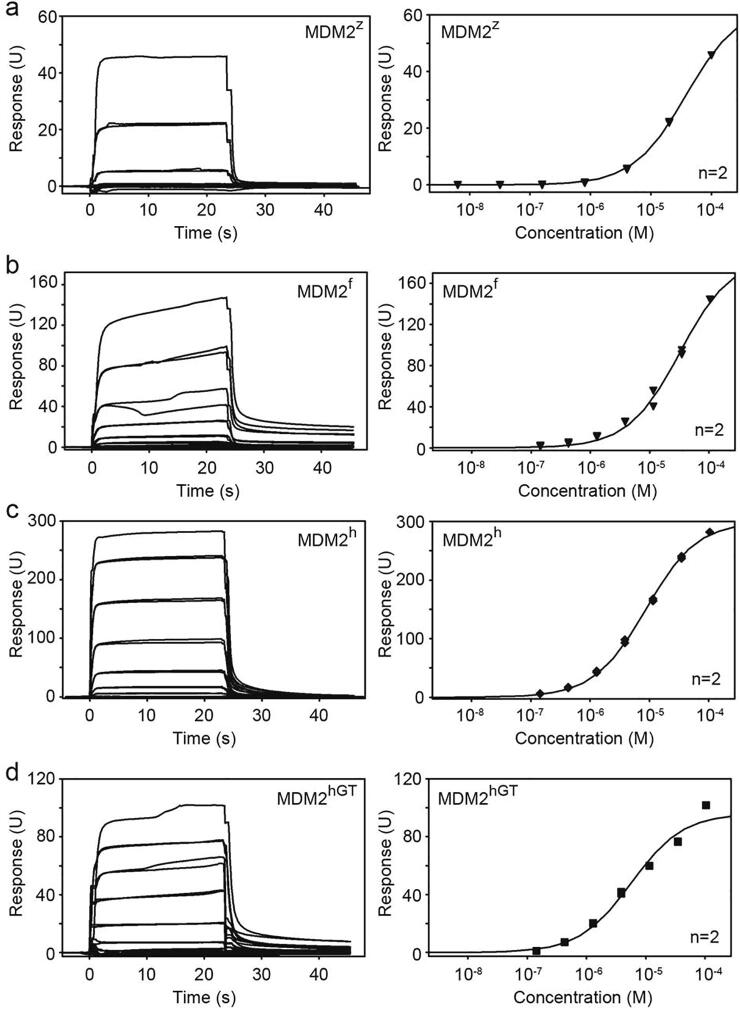
SPR analyses of GST-MDM2 variants and UbcH5B–Ub binding affinities. Representative sensorgrams (left) and binding curves (right) for (a) MDM2z and UbcH5B–Ub, (b) MDM2f and UbcH5B–Ub, (c) MDM2h and UbcH5B–Ub and (d) MDM2hGT and UbcH5B–Ub. n = 2 for each binding curve.
Acknowledgments
This image is the copyrighted work of the attributed author or publisher, and
ZFIN has permission only to display this image to its users.
Additional permissions should be obtained from the applicable author or publisher of the image.
Full text @ J. Mol. Biol.