
|
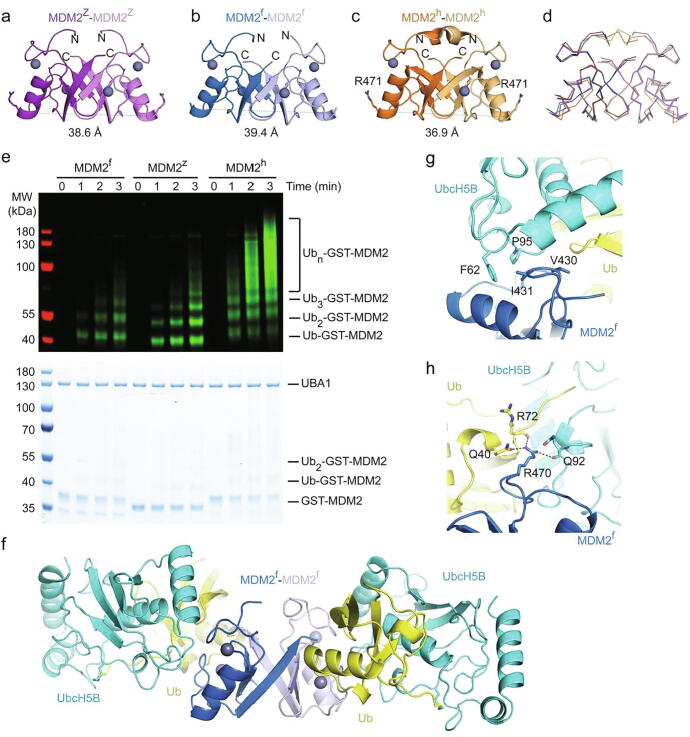
Figure 2
Structural characterization of MDM2f and MDM2z. (a–c) Crystal structures of MDM2z (a; purple/light purple), MDM2f (b; blue/light blue) and MDM2h (c; orange/light orange, PDB: 6SQO). Zinc ions are shown as gray spheres. The diameter of the dimer was calculated by measuring the distance between the Cα atoms of R471 (human nomenclature) of both protomers. (d) Superimposition of (a–c) in ribbon form. (e) Reduced SDS-PAGE showing autoubiquitination reactions catalyzed by GST-MDM2 variants using fluorescently-labeled Ub and visualized by an Odyssey CLx Imaging System (top panel) or stained with Coomassie Blue (bottom panel). (f) Crystal structure of the MDM2f-UbcH5B–Ub complex. UbcH5B and Ub are colored in cyan and yellow, respectively. MDM2f is colored as in b. (g,h) Close-up views of the key interactions between MDM2f and UbcH5B involving MDM2f’s I431 (g) and R470 (h),