
|
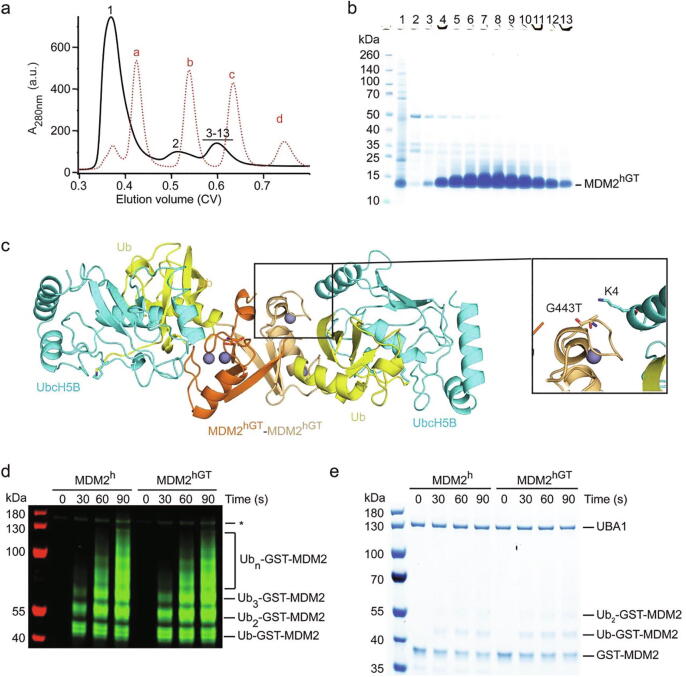
Figure 5
Functional and structural characterization of MDM2hGT. (a) Superdex 75 elution profile of MDM2hGT from a large-scale purification (shown as black solid line). The elution profile of molecular weight markers (a: bovine serum albumin, 66 kDa;b: carbonic anhydrase, 29 kDa; c: cytochrome C, 12.4 kDa; d: aprotinin, 6,5 kDa) is shown as red dashed line. (b) SDS-PAGE showing the purity of single fractions from a. The position of the fractions within the elution profile is indicated by numbers (1–13). The large absorbance in fraction 1 is due to the presence of other contaminants. (c) Crystal structure of the MDM2hGT-UbcH5B–Ub complex. The two MDM2hGT monomers are colored in orange and light orange. Zinc ions are shown as gray spheres. UbcH5B and Ub are colored in cyan and yellow, respectively. A representative close-up view of the local environment of G443T including the sidechain of UbcH5B’s K4 are shown. (d,e) Reduced SDS-PAGE showing autoubiquitination reactions catalyzed by GST-MDM2h and GST-MDM2hGT using fluorescently-labeled Ub and visualized by an Odyssey CLx Imaging System (d) or stained with Coomassie Blue (e). Asterisk in d indicates non-reducible E1–Ub product.