
|
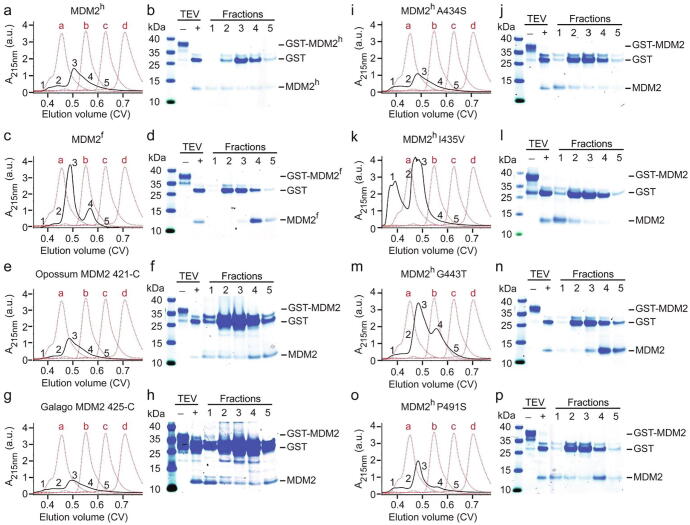
Figure 4
Systematic analysis of MDM2 RING domain aggregation across species (a, c, e, g, i, k, m, o) Superdex 75 elution profiles of MDM2h, MDM2f, opossum MDM2 421-C, galago MDM2 425-C, MDM2h A434S, MDM2h I435V, MDM2h G443T and MDM2h P491S, respectively (shown as black solid line). The elution profile of molecular weight markers (a: bovine serum albumin, 66 kDa; b: carbonic anhydrase, 29 kDa; c: cytochrome C, 12.4 kDa; d: aprotinin, 6,5 kDa) is shown as red dashed line. GST-MDM2 variants (expressed from 2L LB) were treated with TEV then loaded on a Superdex 75 Increase 10/300 column. (b, d, f, h, j, l, n, p) SDS-PAGE showing the GST-MDM2 variants before and after TEV treatment to release the GST-tag (labeled ‘–’ and ‘+’, respectively) and single fractions of the corresponding SEC experiments from panels a, c, e, g, i, k, m, o, respectively. The position of the fractions within the elution profile is indicated by numbers (1–5).