
- Title
-
The bullies are the leaders of the next generation: inherited aminergic neurotransmitter system changes in socially dominant zebrafish, Danio rerio
- Authors
- Sundvik, M., Puttonen, H., Semenova, S., Panula, P.
- Source
- Full text @ Behav. Brain Res.

Locomotion pre and post to the dominance hierarchy test; a) total distance moved (cm), b) angular velocity (degrees/s), and c) frequency of entering the inner zone (times). * = p < 0.05, ** = p < 0.01, Kruskal-Wallis test, Dunn's multiple comparison test. M=male, F=female, DOM=dominant, SUB=subordinate, PRE=before hierarchy test, POST=after hierarchy test, n=9-11 individuals/treatment. Graphs represent mean±SEM. |
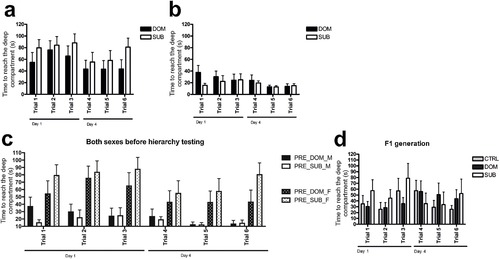
Time spent to reach the deep basin was assessed by the T-maze test before the social hierarchy testing. a) Time spent by females before social hierarchy testing to reach the deep basin, n = 9. Student’s t-test, p < 0.05. Two-way repeated measures analysis of variance, interaction of time and treatment p > 0.05, time p < 0.01, treatment p > 0.05. No significant differences between trials within groups, Tukey's multiple comparisons test. b) Time spent by males before social hierarchy testing to reach the deep basin, n = 11. Student’s t-test, p > 0.05. Two-way repeated measures analysis of variance, interaction of time and treatment p > 0.05, time p > 0.05, treatment p > 0.05. No significant differences between trials within groups, Tukey's multiple comparisons test. c) The time spent by both sexes to reach the deep basin before the social hierarchy testing. p > 0.05 PRE_DOM_M vs PRE_SUB_M, p < 0.001 PRE_DOM_M vs PRE_DOM_F, p < 0.001 PRE_DOM_M vs PRE_SUB_F, p < 0.001 PRE_SUB_M vs PRE_DOM_F, p < 0.001 PRE_SUB_M vs PRE_SUB_F, p < 0.05 PRE_DOM_F vs PRE_SUB_F, One-way analysis of variance, followed by Tukey's multiple comparison test. Two-way repeated measures analysis of variance interaction of time and treatment p > 0.05, time p < 0.001, treatment p < 0.001, no significant differences between trials within groups, Bonferroni's multiple comparisons test, n = 9-11. d) Time spent by the F1 generation males to reach the deep basin before social hierarchy testing, n = 5. Two-way repeated measures analysis of variance, interaction of time and treatment p > 0.05, time p > 0.05, treatment p > 0.05, n = 5/group. M = male, F = female, DOM = dominant, SUB = subordinate, PRE = before hierarchy test. Graphs represent mean ± SEM. |
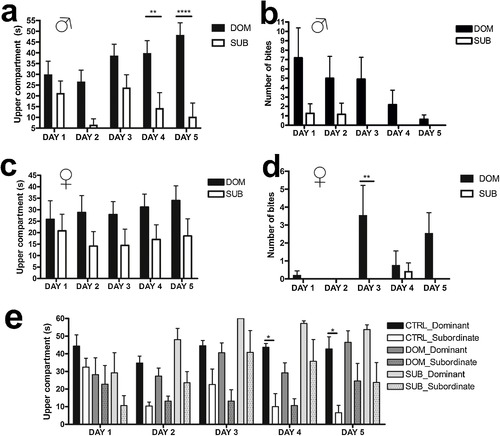
Fish behavior during the social hierarchy test. Dominant fish spend more time in the upper compartment compared with the subordinate fish, and attack/bite the subordinate. a) Time spent by the P generation male fish in the upper compartment of the tank, n = 11. Two-way repeated measures analysis of variance, interaction of time and treatment p < 0.01, time p < 0.01, treatment p < 0.01, Bonferroni's multiple comparisons test, ** = p < 0.01, *** = p < 0.001. b) The number of times the males attacks/bites its test partner during a 1 min test time during 5 subsequent days. Two-way repeated measures analysis of variance, interaction of time and treatment p > 0.05, time p < 0.05, treatment p < 0.05, no significant differences between groups with the Bonferroni's multiple comparisons test. c) Time spent by the P generation female fish in the upper compartment of the tank during a 1 min test time during 5 subsequent days, n = 9. Two-way repeated measures analysis of variance, interaction of time and treatment p > 0.05, time p > 0.05, treatment p > 0.05, no significant differences between groups with the Bonferroni's multiple comparisons test. d) The number of times the female attack/bite the test partner during a 1 min test time during 5 subsequent days. Two-way repeated measures analysis of variance, interaction of time and treatment p < 0.05, time p > 0.05, treatment p < 0.05, Bonferroni's multiple comparisons test, ** = p < 0.01. e) The time spent by the F1 generation control (CTRL), dominant (DOM) and subordinate (SUB) males in the upper compartment of the tank during a 1 min observation period. Two-way repeated measures analysis of variance, interaction of time and treatment p < 0.05, time p > 0.05, treatment p < 0.001, Tukey’s multiple comparisons test, * = p < 0.05. DOM = dominant, SUB = subordinate. Graphs represent mean ± SEM. |
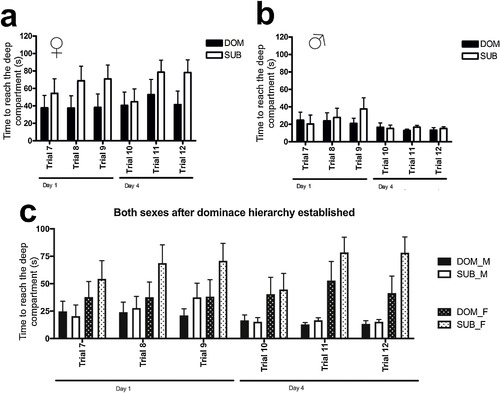
Time needed to reach the deep basin in the T-maze assessed after the social hierarchy test to evaluate if the established social hierarchy affected the performance of fish in the T-maze. a) Time spent by P generation females to reach the deep basin, n = 9. Student’s t-test, p < 0.01. Two-way repeated measures analysis of variance, interaction of time and treatment p > 0.05, time p < 0.01, treatment p > 0.05. No significant differences between trials within groups, Tukey's multiple comparisons test. b) Time spent by the P generation males to reach the deep basin, n = 11. Student’s t-test, p > 0.05. Two-way repeated measures analysis of variance, interaction of time and treatment p > 0.05, time p > 0.05, treatment p > 0.05. No significant differences between trials within groups, Tukey's multiple comparisons test. c) The time spent by both sexes of the P generation to reach the deep basin after the social hierarchy testing. p > 0.05 DOM_M vs SUB_M, p < 0.01 DOM_M vs DOM_F, p < 0.001 DOM_M vs SUB_F, p < 0.01 SUB_M vs DOM_F, p < 0.001 SUB_M vs SUB_F, p < 0.001 DOM_F vs SUB_F), One-way analysis of variance, followed by Tukey's multiple comparison test. DOM=dominant, SUB=subordinate, M=male, F=female. Graphs represent mean±SEM. |

Aminergic system markers (mRNA) assessed by RT-qPCR in whole larvae and brains of adult fish of the F1 generation. a) histidine decarboxylase (hdc) in larvae, b) tyrosine hydroxylase 1 (th1) in larvae, c) tyrosine hydroxylase 2 (th2) in larvae, d) histamine receptor 1 (hrh1) in larvae, e) histamine receptor 2 (hrh2) in larvae, f) histamine receptor 3 (hrh3) in larvae, g) hdc in adults, h) th1 in adults, i) th2 in adults, j) hypocretin (hcrt) in adults, k) glial fibrillary acidic protein (gfap) in adults. * = p < 0.05, ** = p < 0.01, One-way analysis of variance, followed by Tukey's multiple comparison test). CTRL = control, DOM = dominant, SUB = subordinate, larvae n = 6, adults n = 10. Graph represent mean ± SEM. |
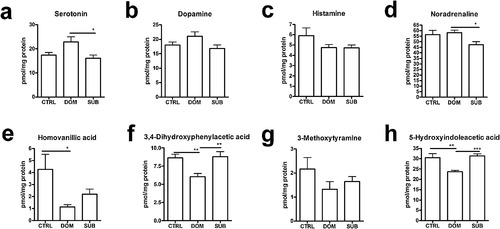
Biogenic amine and metabolite levels in the brains of adult male zebrafish of the F1 generation assessed by HPLC. a) Serotonin, b) dopamine, c) histamine, d) noradrenaline, e) homovanillic acid, f) 3,4-dihydroxyphenylacetic acid, g) 3-methoxytyramine, h) 5-hydroxyindoleacetic acid. * = p < 0.05, ** = p < 0.01, *** = p < 0.001, One-way analysis of variance, followed by Tukey's multiple comparison test. CTRL = control, DOM = dominant, SUB = subordinate, n = 15. Graph represent mean ± SEM. |
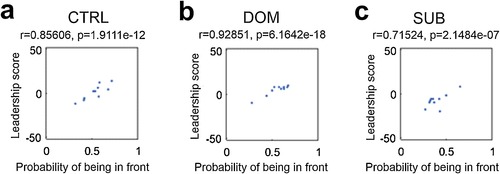
Social leadership behavior of the males in the F1 generation. a) control, b) dominant, and c) subordinate adult zebrafish. CTRL = control, DOM = dominant, SUB = subordinate, n = 5, repeated three times. |
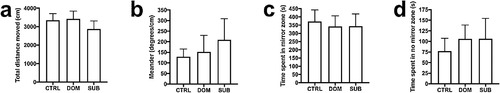
Aggression of the males in the F1 generation. Fish were studied individually during 10 min to assess their aggressive behavior. a) Total distance (cm) moved during 10 min, b) meander (degrees/cm), c) time spent in the mirror zone (seconds), and d) time spent in the zone farthest away from the mirror (seconds). One-way analysis of variance, followed by Tukey's multiple comparison test. CTRL = control, DOM = dominant, SUB = subordinate, n = 12. Graph represent mean ± SEM. |
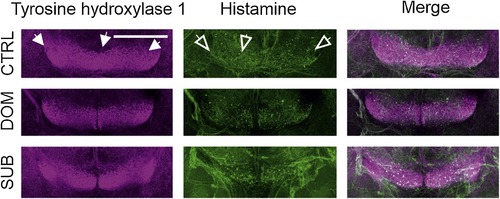
Immunohistochemistry of histamine and tyrosine hydroxylase positive neurons in the adult male brains of the F1 generation. Throughout the images tyrosine hydroxylase immunoreactivity is depicted in magenta and histamine immunoreactivity is depicted in green. The brains are orientated in a similar manner in all sub-images, with the anterior to the top of the page, the posterior to the bottom of the page and the diencephalon and hypothalamus visualized from the ventral side of the brain. A horizontal view. CTRL = control, DOM = dominant, SUB = subordinate. n = 5/group. Scale bar =250 μm. |