
Image
|
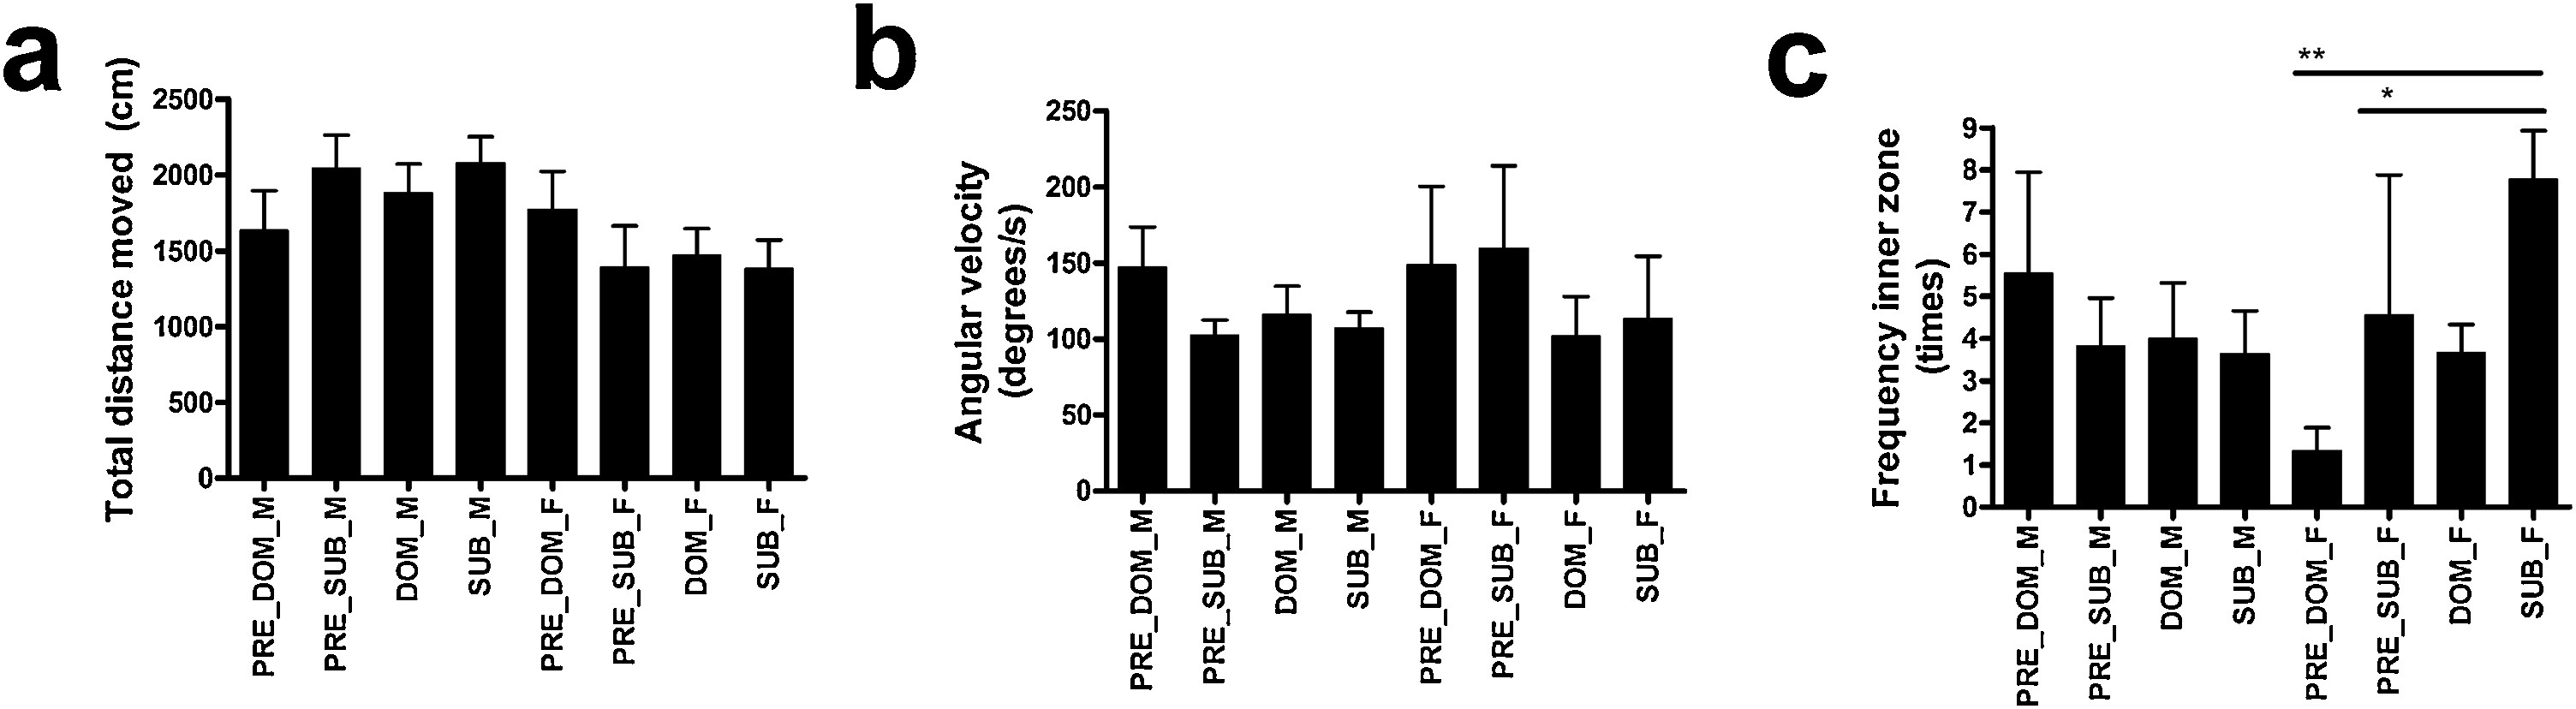
Figure Caption
Fig. 1 Locomotion pre and post to the dominance hierarchy test; a) total distance moved (cm), b) angular velocity (degrees/s), and c) frequency of entering the inner zone (times). * = p < 0.05, ** = p < 0.01, Kruskal-Wallis test, Dunn's multiple comparison test. M=male, F=female, DOM=dominant, SUB=subordinate, PRE=before hierarchy test, POST=after hierarchy test, n=9-11 individuals/treatment. Graphs represent mean±SEM.
Acknowledgments
This image is the copyrighted work of the attributed author or publisher, and
ZFIN has permission only to display this image to its users.
Additional permissions should be obtained from the applicable author or publisher of the image.
Full text @ Behav. Brain Res.