
Image
|
Figure Caption
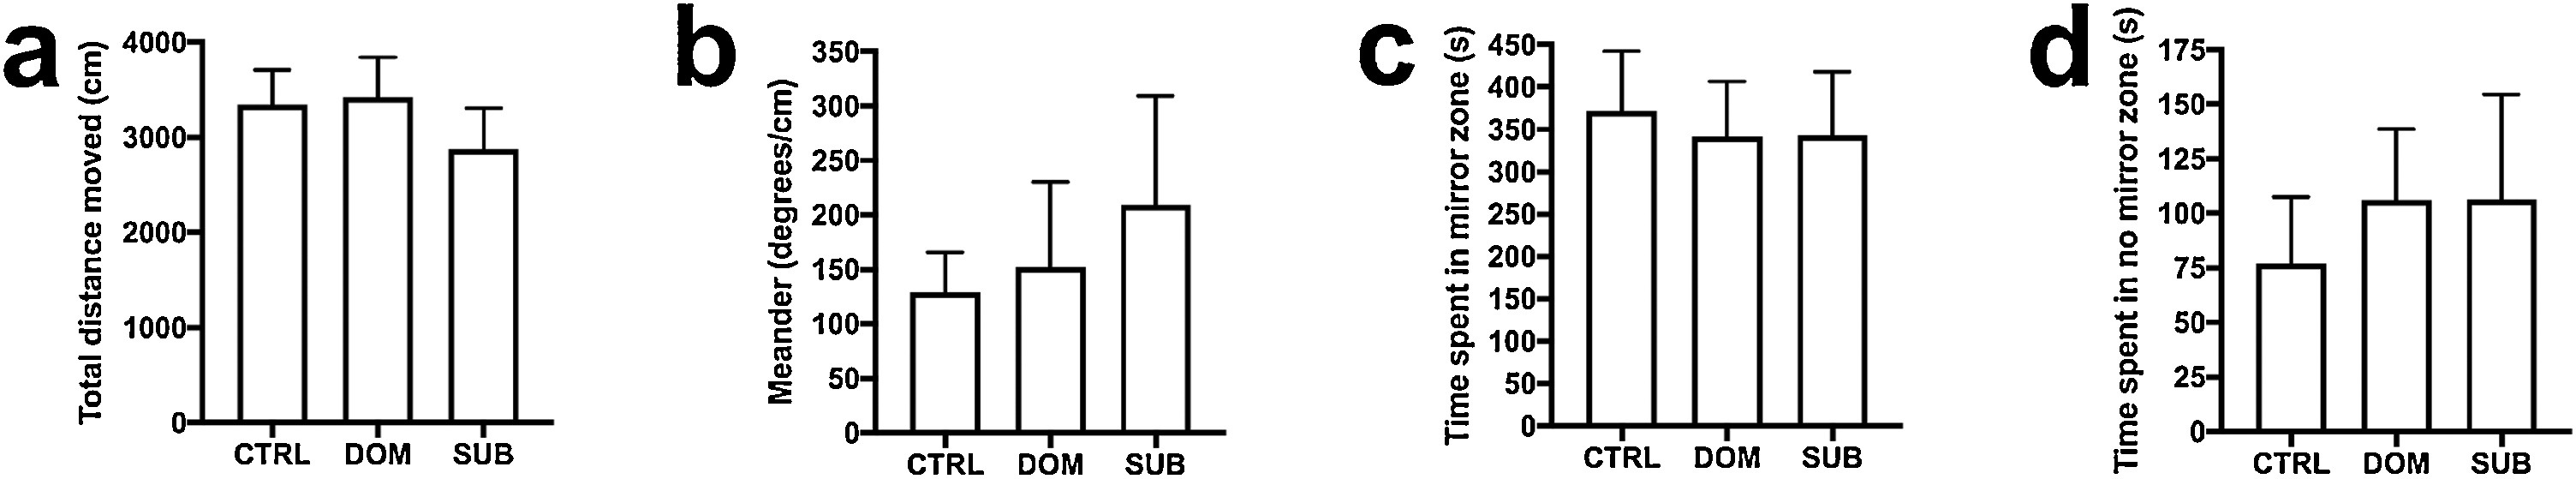
Fig. 8 Aggression of the males in the F1 generation. Fish were studied individually during 10 min to assess their aggressive behavior. a) Total distance (cm) moved during 10 min, b) meander (degrees/cm), c) time spent in the mirror zone (seconds), and d) time spent in the zone farthest away from the mirror (seconds). One-way analysis of variance, followed by Tukey's multiple comparison test. CTRL = control, DOM = dominant, SUB = subordinate, n = 12. Graph represent mean ± SEM.
Acknowledgments
This image is the copyrighted work of the attributed author or publisher, and
ZFIN has permission only to display this image to its users.
Additional permissions should be obtained from the applicable author or publisher of the image.
Full text @ Behav. Brain Res.