
Fig. 4
- ID
- ZDB-FIG-210915-4
- Publication
- Sundvik et al., 2021 - The bullies are the leaders of the next generation: inherited aminergic neurotransmitter system changes in socially dominant zebrafish, Danio rerio
- Other Figures
- All Figure Page
- Back to All Figure Page
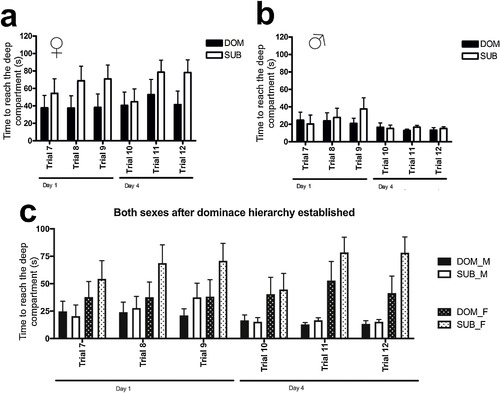
Time needed to reach the deep basin in the T-maze assessed after the social hierarchy test to evaluate if the established social hierarchy affected the performance of fish in the T-maze. a) Time spent by P generation females to reach the deep basin, n = 9. Student’s t-test, p < 0.01. Two-way repeated measures analysis of variance, interaction of time and treatment p > 0.05, time p < 0.01, treatment p > 0.05. No significant differences between trials within groups, Tukey's multiple comparisons test. b) Time spent by the P generation males to reach the deep basin, n = 11. Student’s t-test, p > 0.05. Two-way repeated measures analysis of variance, interaction of time and treatment p > 0.05, time p > 0.05, treatment p > 0.05. No significant differences between trials within groups, Tukey's multiple comparisons test. c) The time spent by both sexes of the P generation to reach the deep basin after the social hierarchy testing. p > 0.05 DOM_M vs SUB_M, p < 0.01 DOM_M vs DOM_F, p < 0.001 DOM_M vs SUB_F, p < 0.01 SUB_M vs DOM_F, p < 0.001 SUB_M vs SUB_F, p < 0.001 DOM_F vs SUB_F), One-way analysis of variance, followed by Tukey's multiple comparison test. DOM=dominant, SUB=subordinate, M=male, F=female. Graphs represent mean±SEM. |