
Fig. 3
- ID
- ZDB-FIG-210915-3
- Publication
- Sundvik et al., 2021 - The bullies are the leaders of the next generation: inherited aminergic neurotransmitter system changes in socially dominant zebrafish, Danio rerio
- Other Figures
- All Figure Page
- Back to All Figure Page
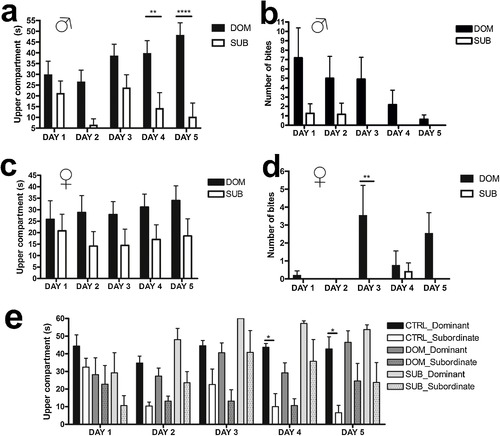
Fish behavior during the social hierarchy test. Dominant fish spend more time in the upper compartment compared with the subordinate fish, and attack/bite the subordinate. a) Time spent by the P generation male fish in the upper compartment of the tank, n = 11. Two-way repeated measures analysis of variance, interaction of time and treatment p < 0.01, time p < 0.01, treatment p < 0.01, Bonferroni's multiple comparisons test, ** = p < 0.01, *** = p < 0.001. b) The number of times the males attacks/bites its test partner during a 1 min test time during 5 subsequent days. Two-way repeated measures analysis of variance, interaction of time and treatment p > 0.05, time p < 0.05, treatment p < 0.05, no significant differences between groups with the Bonferroni's multiple comparisons test. c) Time spent by the P generation female fish in the upper compartment of the tank during a 1 min test time during 5 subsequent days, n = 9. Two-way repeated measures analysis of variance, interaction of time and treatment p > 0.05, time p > 0.05, treatment p > 0.05, no significant differences between groups with the Bonferroni's multiple comparisons test. d) The number of times the female attack/bite the test partner during a 1 min test time during 5 subsequent days. Two-way repeated measures analysis of variance, interaction of time and treatment p < 0.05, time p > 0.05, treatment p < 0.05, Bonferroni's multiple comparisons test, ** = p < 0.01. e) The time spent by the F1 generation control (CTRL), dominant (DOM) and subordinate (SUB) males in the upper compartment of the tank during a 1 min observation period. Two-way repeated measures analysis of variance, interaction of time and treatment p < 0.05, time p > 0.05, treatment p < 0.001, Tukey’s multiple comparisons test, * = p < 0.05. DOM = dominant, SUB = subordinate. Graphs represent mean ± SEM. |