
- Title
-
Anti-High Mobility Group Box-1 Monoclonal Antibody Attenuates Seizure-Induced Cognitive Decline by Suppressing Neuroinflammation in an Adult Zebrafish Model
- Authors
- Paudel, Y.N., Othman, I., Shaikh, M.F.
- Source
- Full text @ Front Pharmacol

Pictorial representation of experimental procedure. The figure depicts the several time points (at day 1 and day 10) in the corresponding experimental groups where treatments were performed with VC, Pilo, PTZ, DZP and three doses of mAb. In day 1 and day 10, there is a recording of locomotor behavior for 15 min for each experimental group. On day 10, in the DZP groups and mAbs groups, pre-treatment was done 30 min prior to PTZ administration. Starting from day 10, T-maze test were performed for each group at the interval of 0h, 3h and 24 h. After 24 h T-maze test, all the fish were euthanized, and brain samples were collected which were further subjected to biochemical investigations. D1, Day 1; D10, Day 10, D11, Day 11; VC, Vehicle control (10% DMSO, I.P.); DMSO, dimethyl sulfoxide; I.P., Intraperitoneal; Pilo, Pilocarpine (400 mg/kg, I.P.); PTZ, Pentylenetetrazol (80 mg/kg, I.P.); DZP, Diazepam (1.25 mg/kg, I.P.); mAb 1, Anti-HMGB1 mAb (1 mg/kg, I.P.); mAb 2.5, Anti-HMGB1 mAb (2.5 mg/kg, I.P.); mAb 5, Anti-HMGB1 mAb (5 mg/kg, I.P.). |
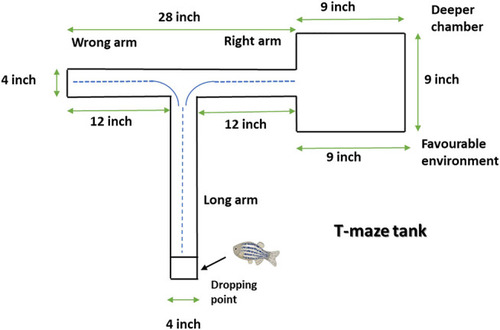
Representative diagram of T-maze tank. Zebrafish is kept at the dropping point and recorded the time taken to reach the deeper/bigger chamber. The blue dotted line denotes the representative swimming pattern of zebrafish that begins from the dropping point. |

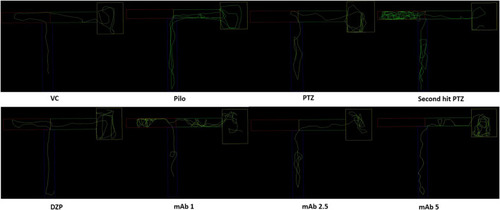
Representative swimming patterns for the corresponding experimental groups (n = 12) at day 10. Represents the swimming pattern of VC, Pilo, PTZ, second hit PTZ, DZP, mAb 1, mAb 2.5, and mAb 5 groups. |
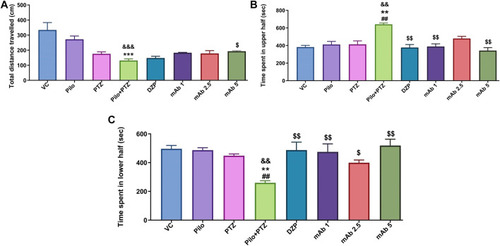
Mean locomotor parameters of the experimental groups (n = 12) at day 10. Mean locomotion parameters of the experimental groups representing the mean total distance traveled (cm) |

Anti-epileptic effect of mAb against second hit PTZ-induced seizures. Seizure scores of corresponding experimental groups are demonstrated for day 10. Data are represented as mean ± SEM, n = 12, and statistically analyzed by one-way ANOVA followed by Sidak’s multiple comparison test. &&&& |
T-maze tracking pattern (24 h trial) of locomotor behavior for the corresponding experimental groups (n = 12). Represents the swimming pattern of VC, Pilo, PTZ, second hit PTZ, DZP, mAb 1, mAb 2.5, and mAb 5 groups. |

Graph plot of the inflection ratio at the 3 h and 24 h T-maze trial of the corresponding experimental groups. Inflection ratio at the 3 h |

Analysis of Neurotransmitters level in epileptic zebrafish brains after pre-treatment with anti-HMGB1 mAb. Concentration of GABA |

Modulation of inflammatory mediator (HMGB1, TLR4, NF-κB, TNF-α), transcription factor (CREB-1) and neuropeptide (NPY). The graph plot is represented as a fold changes in mRNA expression of HMGB1 (A), TLR4 (B), NF-κB (C), TNF-α (D), CREB-1 (E) and NPY (F). Data are represented as mean ± SEM, n = 6, and statistically analyzed by one-way ANOVA followed by Sidak’s multiple comparison test. &&&p < 0.001 and &p < 0.05 represents the significance level when second hit PTZ group is compared with VC group. ***p < 0.001 and *p < 0.05 represents the significance level when second hit PTZ group is compared with Pilo group. ###p < 0.001 and ##p < 0.01 represents the significance level when second hit PTZ group is compared with PTZ group. $$$p < 0.001, $$p < 0.01 and $p < 0.05 represent the significance level when DZP, mAb 1, mAb 2.5, and mAb 5 treated groups is compared with second hit PTZ group. |