IMAGE

FIGURE 4

ID
ZDB-IMAGE-210320-12
Source
Figures for Paudel et al., 2021
Image
Figure Caption

FIGURE 4

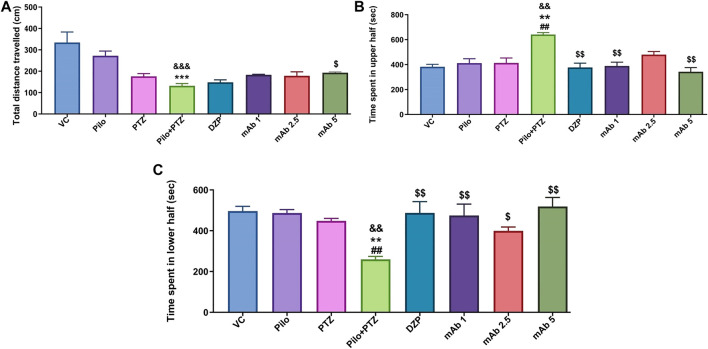
Mean locomotor parameters of the experimental groups (n = 12) at day 10. Mean locomotion parameters of the experimental groups representing the mean total distance traveled (cm) (A), mean time spent in upper half of the tank in (seconds) (B) and the mean time spent in lower half of the tank (seconds) (C). Data are represented as mean ± SEM, n = 12, and statistically analyzed by one-way ANOVA followed by Sidak’s multiple comparison test. &&&p < 0.001 and &&p < 0.01 represent the significance level when second hit PTZ group is compared with VC group. ***p < 0.001 and **p < 0.01 represent the significance level when second hit PTZ group is compared with Pilo group. $$p < 0.01 and $p < 0.05 represents the significance level when DZP, mAb 1, mAb 2.5, and mAb 5 treated groups is compared with second hit PTZ group.

Acknowledgments
This image is the copyrighted work of the attributed author or publisher, and ZFIN has permission only to display this image to its users. Additional permissions should be obtained from the applicable author or publisher of the image. Full text @ Front Pharmacol