|
FIGURE 7
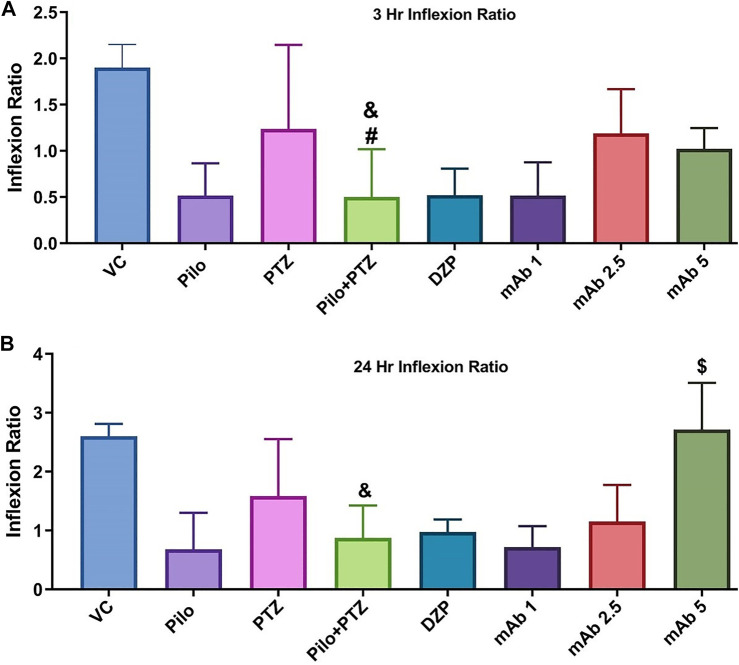
Graph plot of the inflection ratio at the 3 h and 24 h T-maze trial of the corresponding experimental groups. Inflection ratio at the 3 h

|
|
FIGURE 7
Graph plot of the inflection ratio at the 3 h and 24 h T-maze trial of the corresponding experimental groups. Inflection ratio at the 3 h